Pulling the Thread
Takeaway: This post begins from a causal question prose alone could not resolve, then turns to a toy model not for grand prediction, but for sharper structural reasoning.
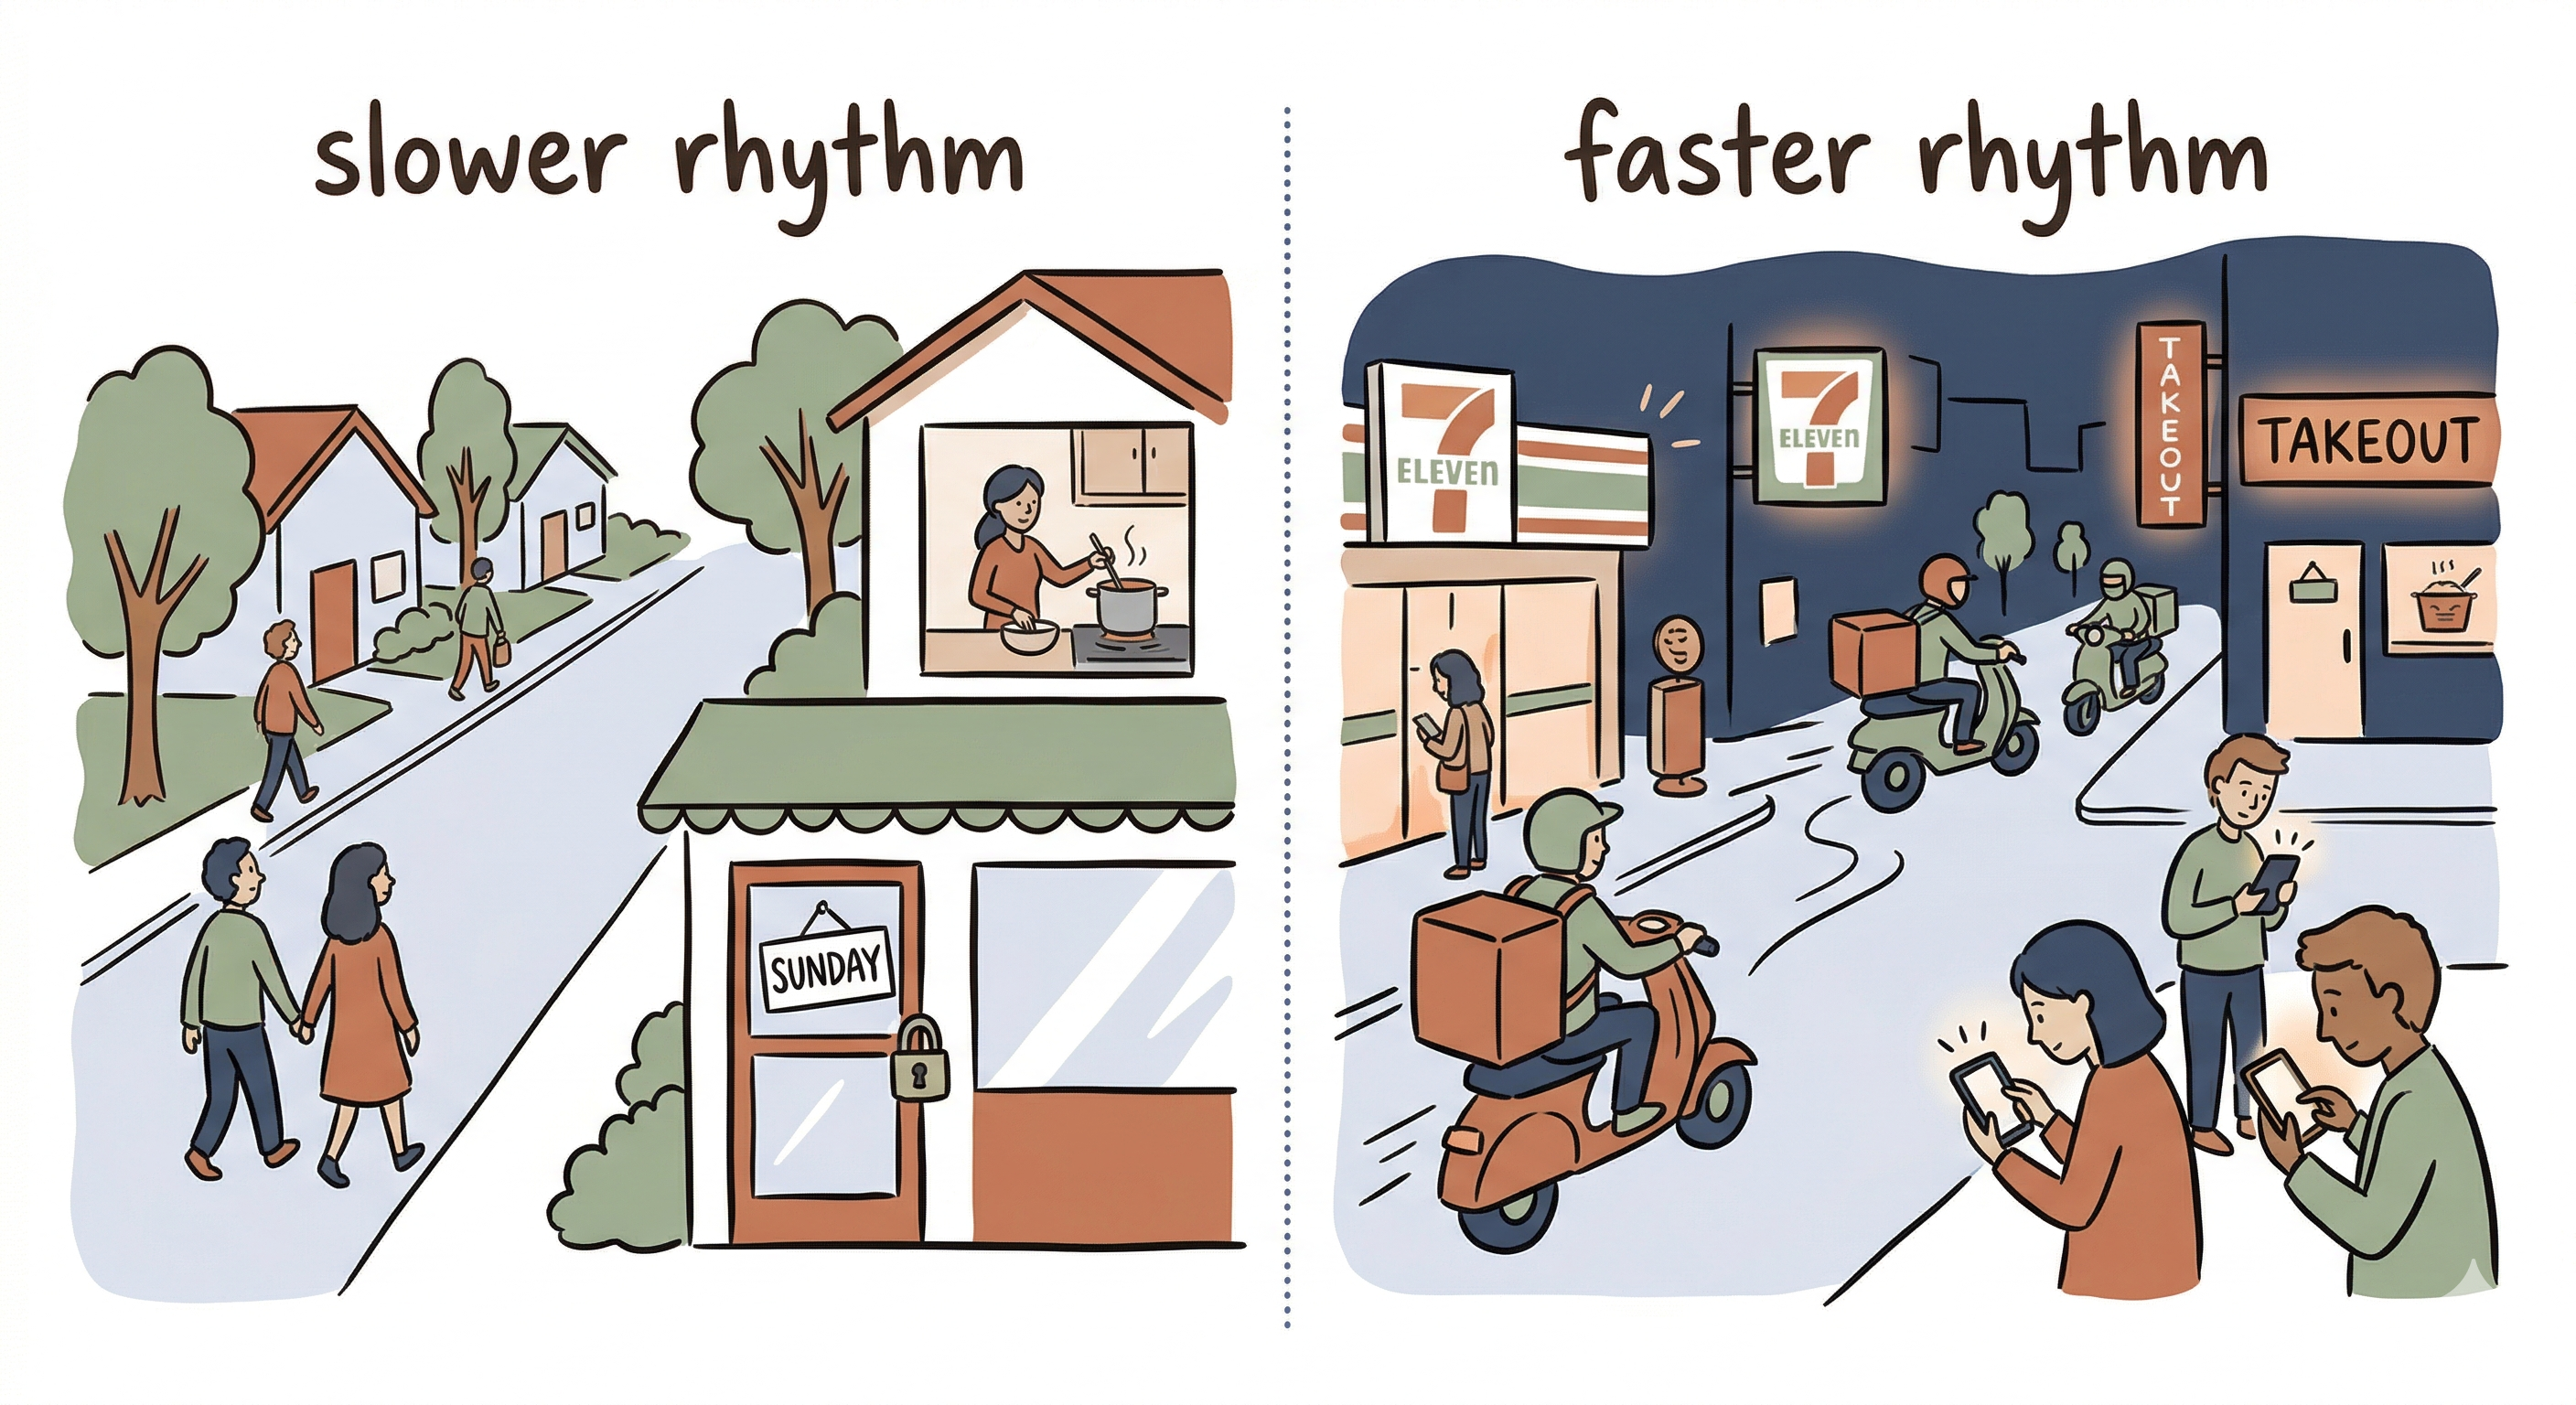
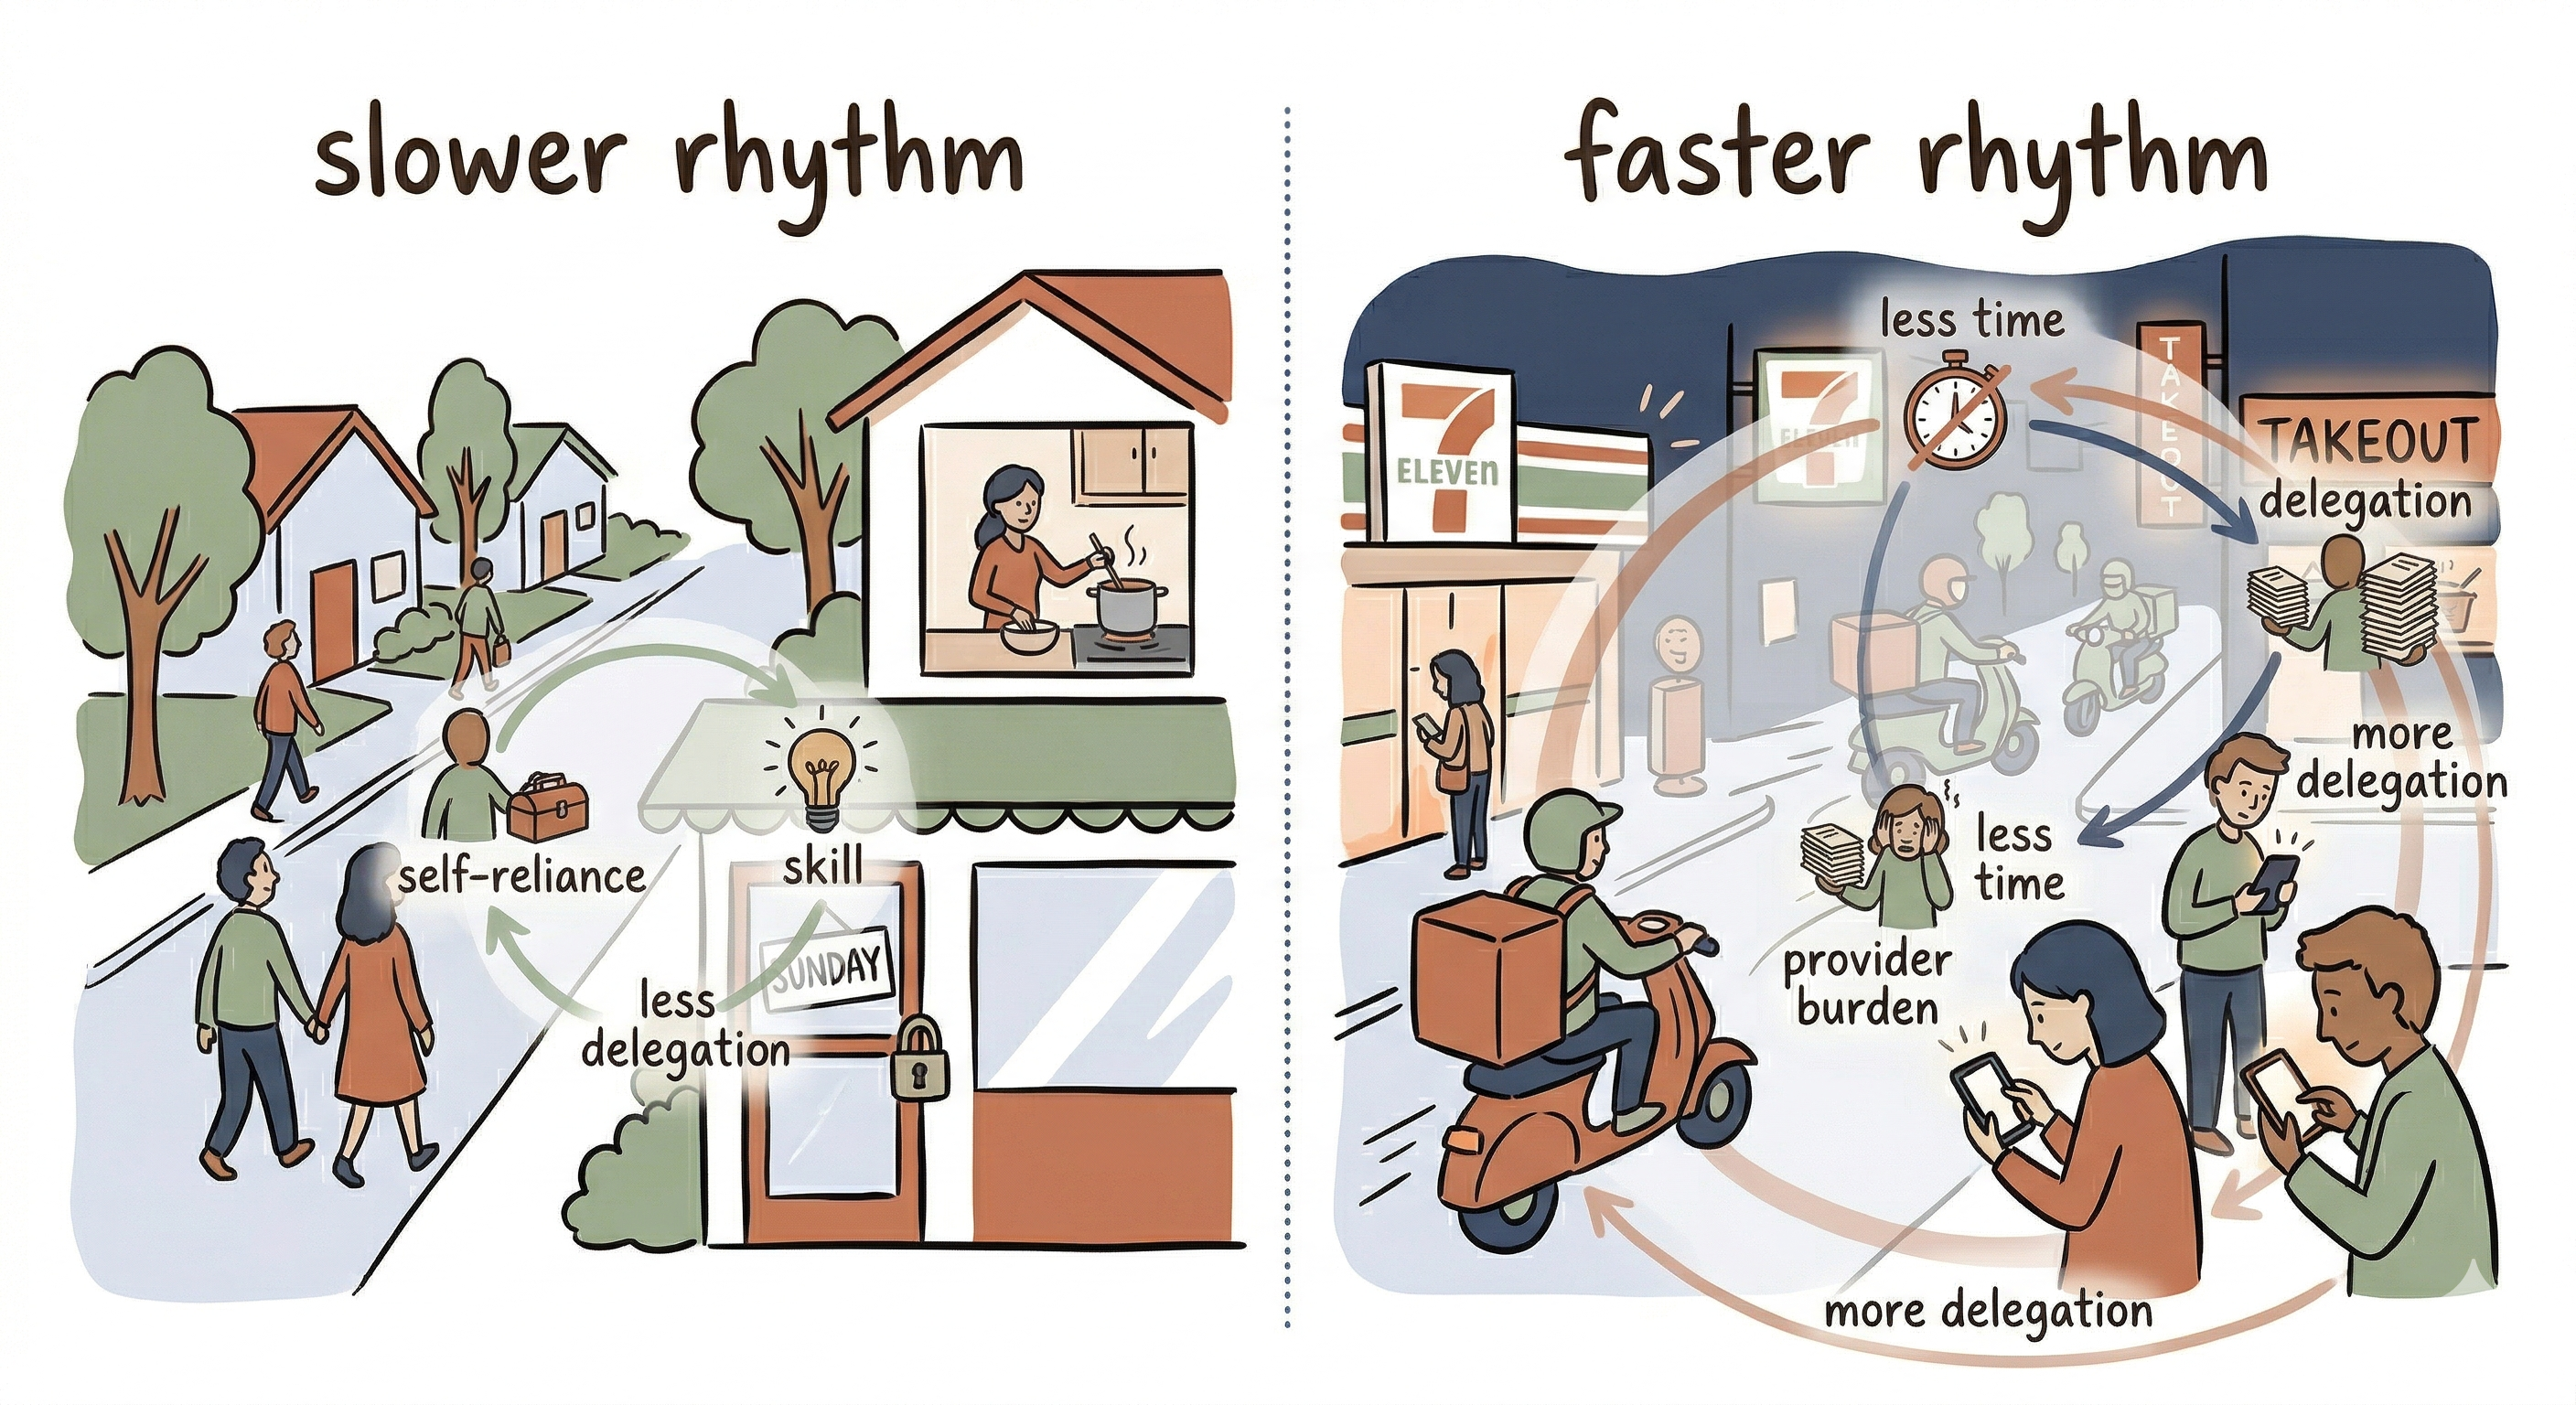
In my previous post, I stood in front of a closed supermarket on a Sunday afternoon and started pulling a thread. That small friction — a locked door, a fifteen-minute drive to the next shop — unraveled into something much larger: a web of feedback loops connecting convenience, autonomy, service pricing, and social norms into two distinct architectures of everyday life.
I described two rhythms. One where individuals handle most tasks personally, tolerate slower timelines, and pay higher prices for the services they do use. Another where delegation is the default, services are cheap and abundant, and the entire infrastructure assumes you will outsource rather than self-serve. These are not random cultural differences, I argued. They are emergent properties of interconnected social mechanisms, each reinforcing the other.
The question I could not answer was simple to state and hard to untangle: which came first — the cheap service or the dependency on it?
That question haunted me. It was too tangled for prose alone — too many interacting parts, too many feedback loops running in parallel, too many plausible stories that all sounded equally convincing. So I did what a systems engineer does when a problem resists verbal reasoning: I built a model.
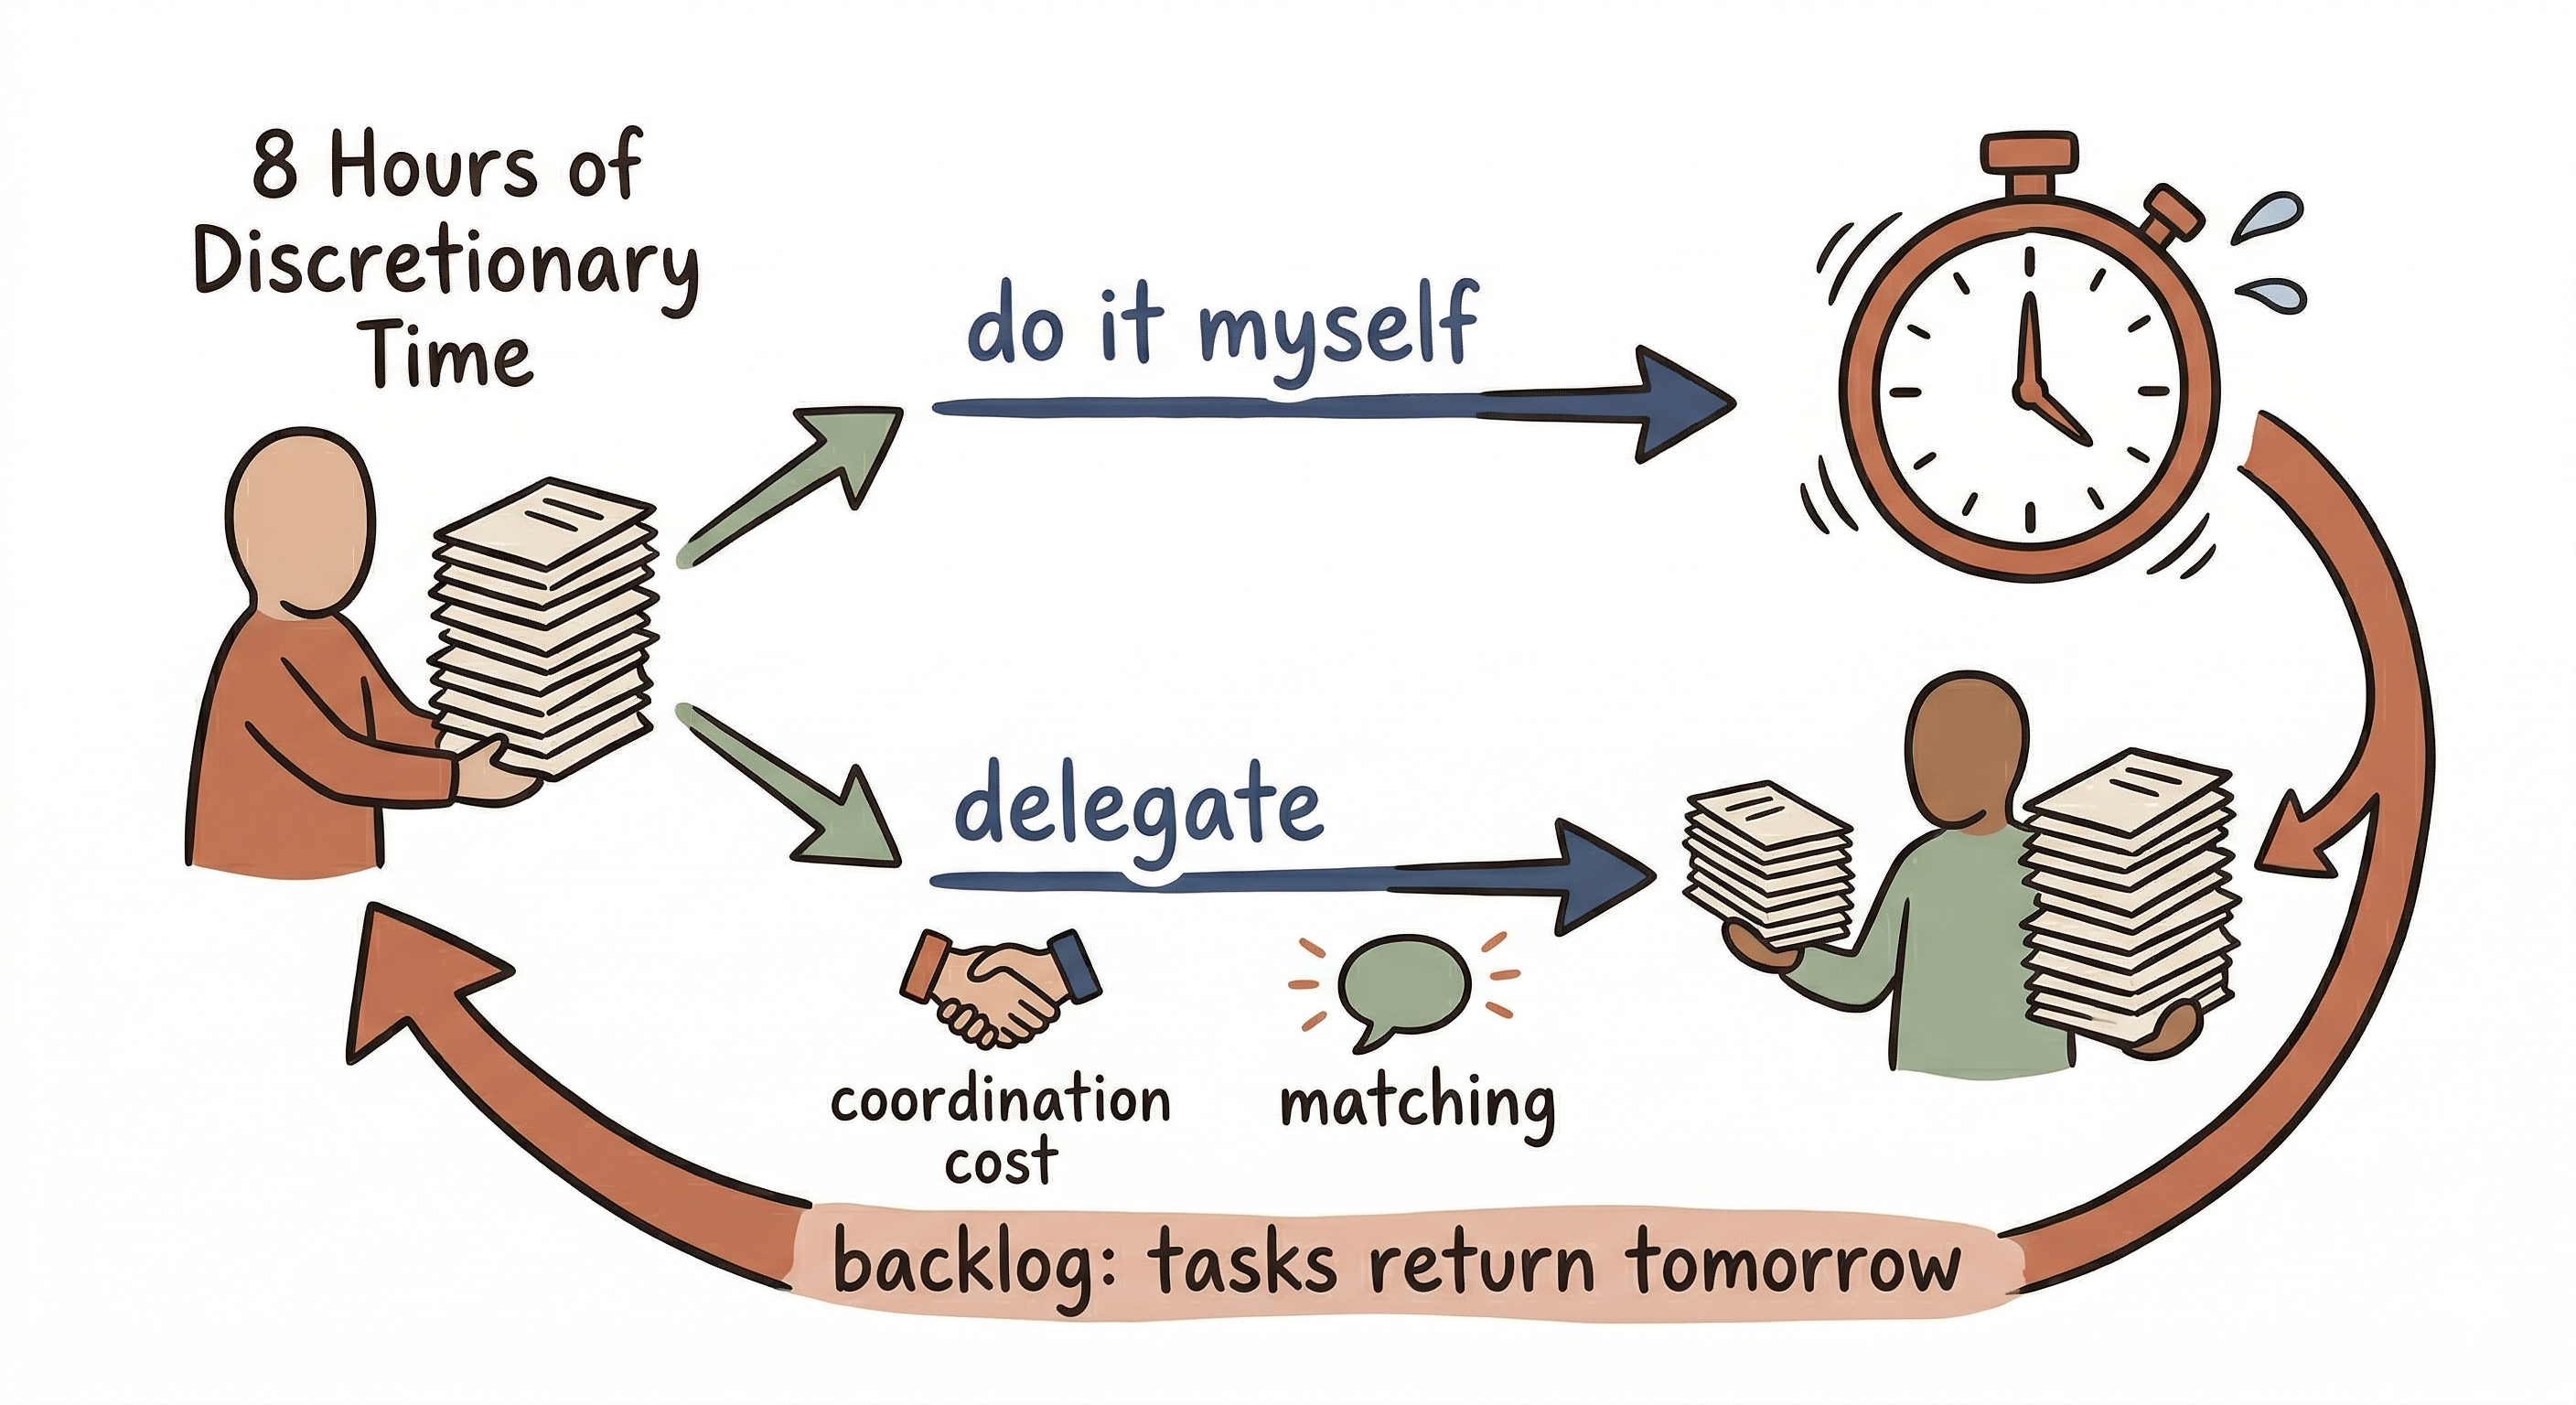
Not a grand model. A toy. One hundred simulated agents, each given eight hours of discretionary time per day, a handful of tasks, and a single decision to make for each one: do it myself, or hand it to someone else? I ran this toy world 14,656 times under different configurations, sweeping across delegation preferences, task pressures, service costs, and conformity levels. What emerged surprised me — not because the model answered my questions, but because of how it sharpened them.
This post is the story of what I found. Every number reported here comes from actual simulation runs. Every chart was generated from real data. And every limitation is stated honestly — because a toy model that knows its edges is more useful than a grand theory that pretends it has none.
This essay is a blog-oriented adaptation of the underlying formal research report for the project. Readers who want the more technical source document can find it here: formal research report.
Rules of a Small World
Takeaway: The model is deliberately simple, but its simplifications are explicit: every agent has limited time, every delegated task still has to be done by someone, and overload accumulates rather than disappearing.
A toy model is not a small model. It is a transparent one. Every rule is visible, every assumption stated. What it lacks in realism, it gains in honesty. You can take it apart, inspect every gear, and decide for yourself whether the simplifications matter. Here are the rules of this particular toy world.
One hundred agents live on a small-world network — a social graph where most connections are local (like a tight-knit neighborhood) but a few long-range links allow information and norms to diffuse across the entire society. Each morning, every agent wakes up with 8.0 hours of discretionary time and receives a random stack of daily tasks — cooking, errands, paperwork, repairs — between one and five per day. For each task, the agent makes a single choice: do it myself, or delegate it to someone else.
That choice is not random. It integrates four pressures into a single delegation probability:
- Cultural disposition — an inherent tendency toward self-reliance or delegation, initialized from a distribution that differs between society types and evolving over time through social influence
- Stress — when available time runs short, agents are more likely to delegate as a coping mechanism, adding 30% of their stress level to the delegation probability
- Skill — agents skilled at a particular task type gain less from outsourcing it; high proficiency reduces the urge to delegate
- Cost — expensive services discourage delegation; cheap ones remove the economic brake
The agent combines these four forces, flips a weighted coin, and acts. Simple. Auditable. No hidden weights, no opaque neural networks, no black-box magic.
Here is the critical design choice that makes the paradox possible: every agent is both a potential delegator and a potential provider. There is no separate “worker class.” The same person who orders takeout might spend the next hour delivering someone else’s groceries. And crucially, unmatched tasks — those that no provider has time to fulfil — do not vanish. They carry over to the next day as backlog. This makes overload cumulative. Convenience that exceeds capacity does not gracefully degrade; it compounds.
Figure 1 — The feedback loops driving the convenience paradox

Two reinforcing feedback loops drive the dynamics. R1 (the stress spiral): stress pushes agents to delegate more, delegation creates provider burden, burden depletes available time, depleted time creates more stress — which triggers even more delegation. R2 (the norm lock-in): as delegation becomes widespread, it reinforces social norms around convenience, those norms make delegation feel natural and expected, which encourages even more delegation. In a low-delegation society, these loops stay quiet. In a high-delegation society, they hum constantly.
I configured two society presets to test these loops. Type A (Autonomy-Oriented): delegation preference mean 0.25, service cost factor 0.65, social conformity pressure 0.15, mean task load 2.2 per step. Type B (Convenience-Oriented): delegation preference mean 0.72, service cost factor 0.20, conformity pressure 0.65, mean task load 2.8 per step. Same agents, same 8-hour days, same task types. What changes is the preset architecture around the day: how much work enters it, how agents respond to that work, and how strongly the surrounding norm pushes them toward delegation.
This is not a crystal ball. It is a sketch on a napkin — but a sketch with rules you can inspect, assumptions you can challenge, and parameters you can twist.
The 30% Question
Takeaway: The headline result is real but easy to overread: the convenience-oriented preset bundle costs about 30% more total labor, but delegation alone explains only a much smaller share of that gap.
The first thing the model told me was a number: 30%.
Type B societies — or more precisely, the full Type B preset bundle of higher delegation, cheaper services, stronger conformity, and heavier task load — generate approximately 30% more total system labor than Type A societies. Not 30% more output. Not 30% more productivity. Thirty percent more hours worked across all agents combined.
This gap appears at simulation step 120 (31.1%) and is still there at step 450 (30.0%). It is not a warm-up artifact or a transient fluctuation. Run the simulation for 120 days or 450 days — the preset-level premium holds steady. But the dramatic number needs a narrower reading than I first gave it. Horizon stability tells us the Type A / Type B gap is structural. It does not tell us delegation alone caused the whole thing. The two presets differ on several parameters, most importantly task load (2.2 vs 2.8 tasks per step). In decomposition runs, once Type B’s task load is aligned back to 2.2, the remaining labor premium shrinks to roughly 3–4%. The 30% number survives. The interpretation changes.
Figure 2 — Type A and Type B remain structurally different across longer horizons

The six panels above track the gap across four time horizons. Total labor hours: consistently higher for Type B (~566h vs ~435h). Average stress: persistently elevated (0.052 vs 0.039). Available time at day’s end: Type A agents retain about 3.65 hours — 46% of their 8-hour budget — while Type B agents retain 2.46 hours, just 31%. Delegation rates: 8.9% versus 64.5%, a sharp and stable separation that shows these two configurations inhabit fundamentally different behavioral regimes.
But the population average hides individual variation. What does the gap look like at the agent level?
Figure 3 — Available time distribution at final step

Type A agents spread widely across the time axis — some have barely an hour left, others have nearly 6. Their strategies are diverse, their outcomes heterogeneous. Type B agents cluster tightly around 2.5 hours. Conformity pressure homogenizes their outcomes: high social pressure does not just shift the average, it narrows the distribution. The convenience-oriented society does not just have less free time on average — it has less variance in free time. The norm flattens everyone to the same compressed rhythm.
In my previous blog, I described the closed supermarket as a friction that felt like a flaw but might signal something deeper. In the model, that friction corresponds not just to lower delegation in the abstract, but to a lower-delegation, lower-task-pressure preset world — and that world uses about 30% less total system labor and preserves nearly 50% more retained personal time. The inconvenience was not a bug. It was a trace of a different time-allocation architecture.
The Cliff at 3.0
Takeaway: The system does not degrade smoothly under pressure; it crosses a narrow threshold and flips from stable operation into backlog-driven overload.
The 30% gap is striking but static — a comparison between two stable configurations. The next question is dynamic: what happens when you turn up the pressure? Is the transition from manageable to overloaded gradual, or is there a tipping point?
I ran a systematic parameter sweep across delegation preference (0.05 to 0.95) and daily task load (1.5 to 5.5 tasks per step), mapping total labor hours across the full parameter space. Each cell in the resulting grid represents the average of multiple simulation runs. The result is a phase atlas — a map of the system’s behavioral landscape. And it contains a cliff.
Figure 4 — Delegation-task load phase atlas: backlog emergence

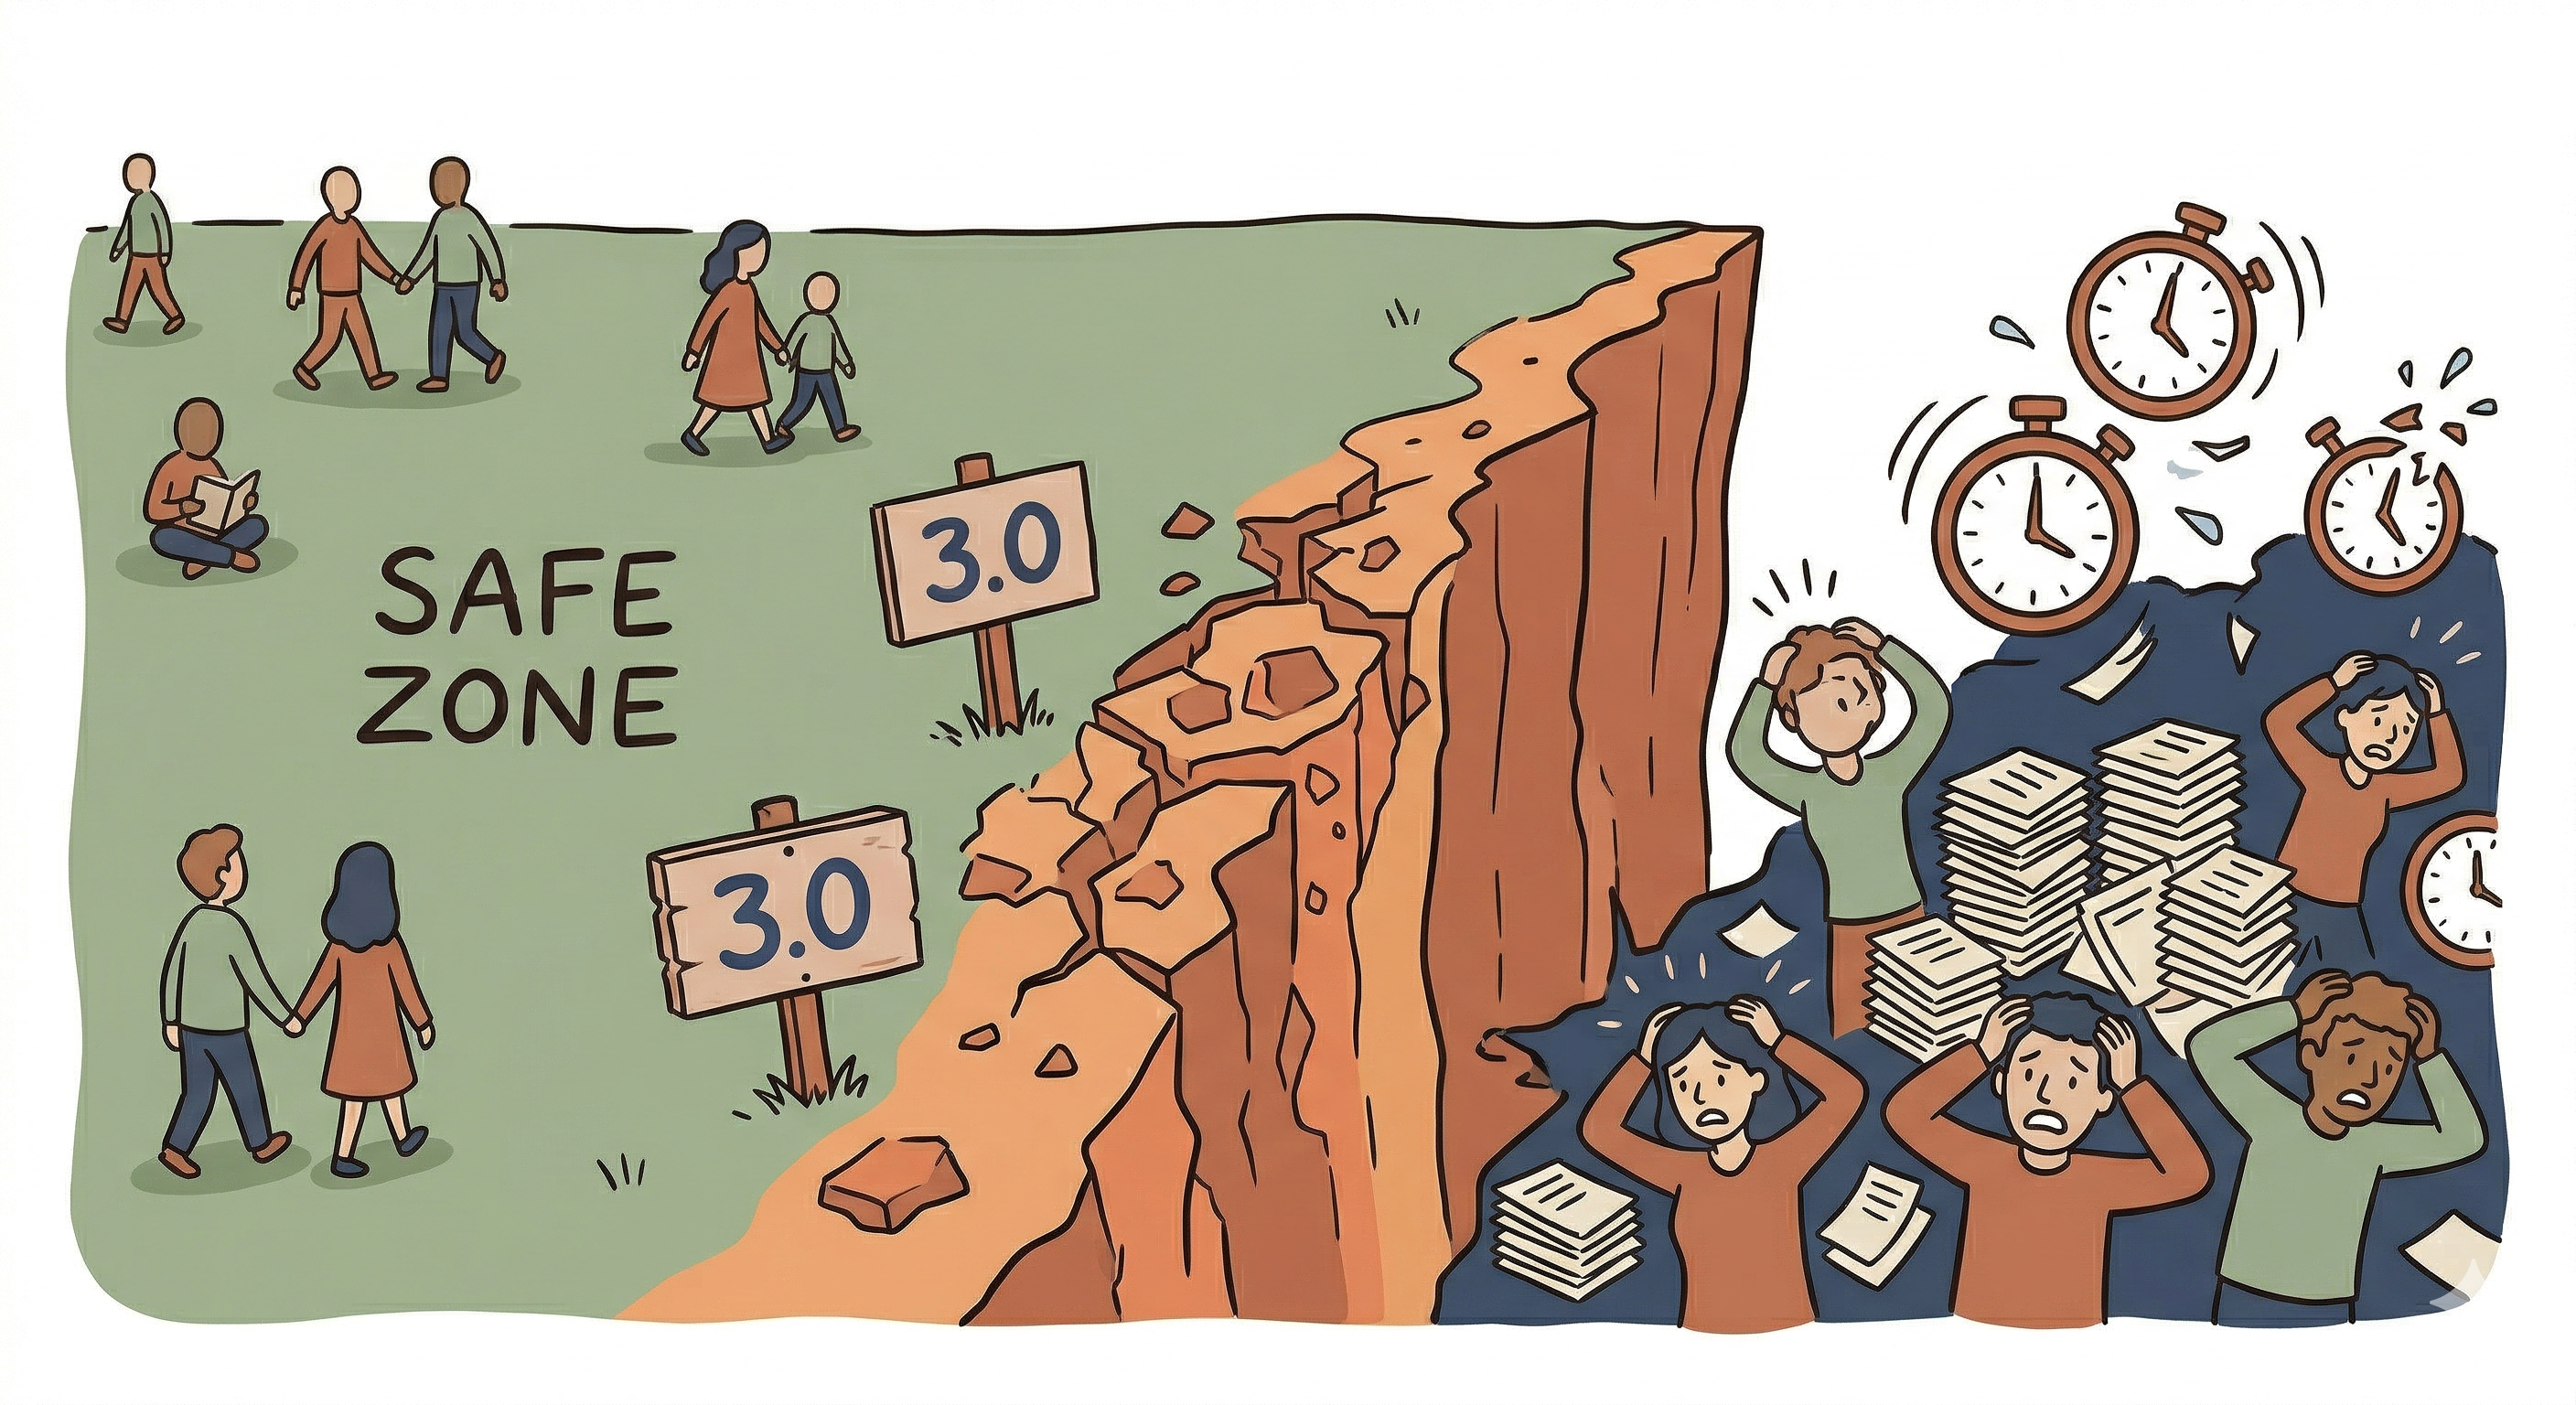
Three regimes emerge cleanly from the data. Below roughly 3.0 tasks per step, everything is manageable — backlogs stay at zero regardless of how much the population delegates. This is the safe zone: even high-delegation societies can function here because the demand on service providers does not exceed their available capacity. Between 3.0 and 3.25, the system enters a narrow transition band where the first backlogs appear — tasks that go unmatched because no provider has enough remaining time. Above 3.25, high-delegation configurations spiral into catastrophic overload.
The transition is not a gentle slope. It is roughly 0.25 task-load units wide — a cliff, not a hill. This is classic phase-transition behavior from complexity science: the system does not gradually worsen; it flips regimes across a narrow boundary.
To make this tangible, I tracked four “story cases” through time — each representing a distinct point in the parameter space.
Figure 5 — System dynamics: four story cases from relief to overload

The autonomy baseline hums along quietly: stress 0.034, total labor 428 hours, zero backlog. A society that mostly takes care of itself. The convenience baseline is costlier but stable: stress 0.052, total labor 567 hours, still zero backlog. The system absorbs the overhead of delegation without breaking. The threshold-pressure case teeters at the edge: stress rises to 0.189, intermittent backlogs appear and recede, the system oscillates near its breaking point.
Then the overloaded case. Stress saturates at 1.0 — the maximum — within approximately 50 simulated days. Backlog grows exponentially, reaching 133,788 unmatched tasks by the simulation’s tail window. Total labor hits 800 hours, meaning every single agent is working every available minute of every day. This is involution in its precise Geertzian sense: intensification without development. The system is busier than it has ever been. No one is better off.
Where Did the Time Go?
The threshold tells us when the system breaks. The labor decomposition tells us how the system has already changed before it breaks.
Takeaway: Even before collapse, convenience rewires the labor budget: self-service shrinks, provider work expands, and coordination overhead quietly absorbs the claimed time savings.
Figure 6 — Labor composition: convenience reshapes before it overloads

Look at the autonomy baseline first. Self-labor accounts for 380.2 of 428.3 total hours — roughly 89% of all work. Service labor is a thin slice (45.0 hours), coordination overhead barely visible (3.1 hours). People mostly handle their own tasks. The system is quiet, simple, self-contained.
Now look at the convenience baseline — still a stable, non-overloaded system, well within the safe zone. The composition has fundamentally changed. Self-labor drops to 177.3 hours — just 31% of the total. Service labor balloons to 361.4 hours. Coordination overhead grows ninefold to 28.1 hours. Total: 566.8 hours. That is 138.5 hours more than the autonomy baseline, for the same population operating under a busier preset bundle.
Where did the extra 138.5 hours come from? Not from one source alone. Part of it comes from the fact that the convenience baseline is asked to handle a heavier task load in the first place. Part comes from what delegation does to those tasks once they are outsourced. Every delegated task incurs a 15% coordination cost — matching agents to tasks, communication overhead, handoff friction. Providers handling someone else’s task work at roughly 0.6 proficiency — because they do not know your kitchen layout, your filing system, or your definition of “done.” That means every delegated hour costs approximately 1.67 provider-hours. These overheads are individually modest. Collectively, they help explain why the equal-task-load delegation premium stays positive, while the much larger published 30% gap belongs to the whole preset architecture rather than delegation alone.
The dual-role design makes this vivid. Imagine Alice delegates her cooking (0.8 hours) to save time. She is then matched as a provider for Bob’s errand, spending 0.83 hours at reduced proficiency. Net personal time saved: negative 0.03 hours. Bob delegates his errand (0.5 hours) to save time, then provides Alice’s cooking for 1.33 hours. Net: negative 0.83 hours. Both acted individually rationally. Both ended the day with less free time than if they had simply done their own tasks.
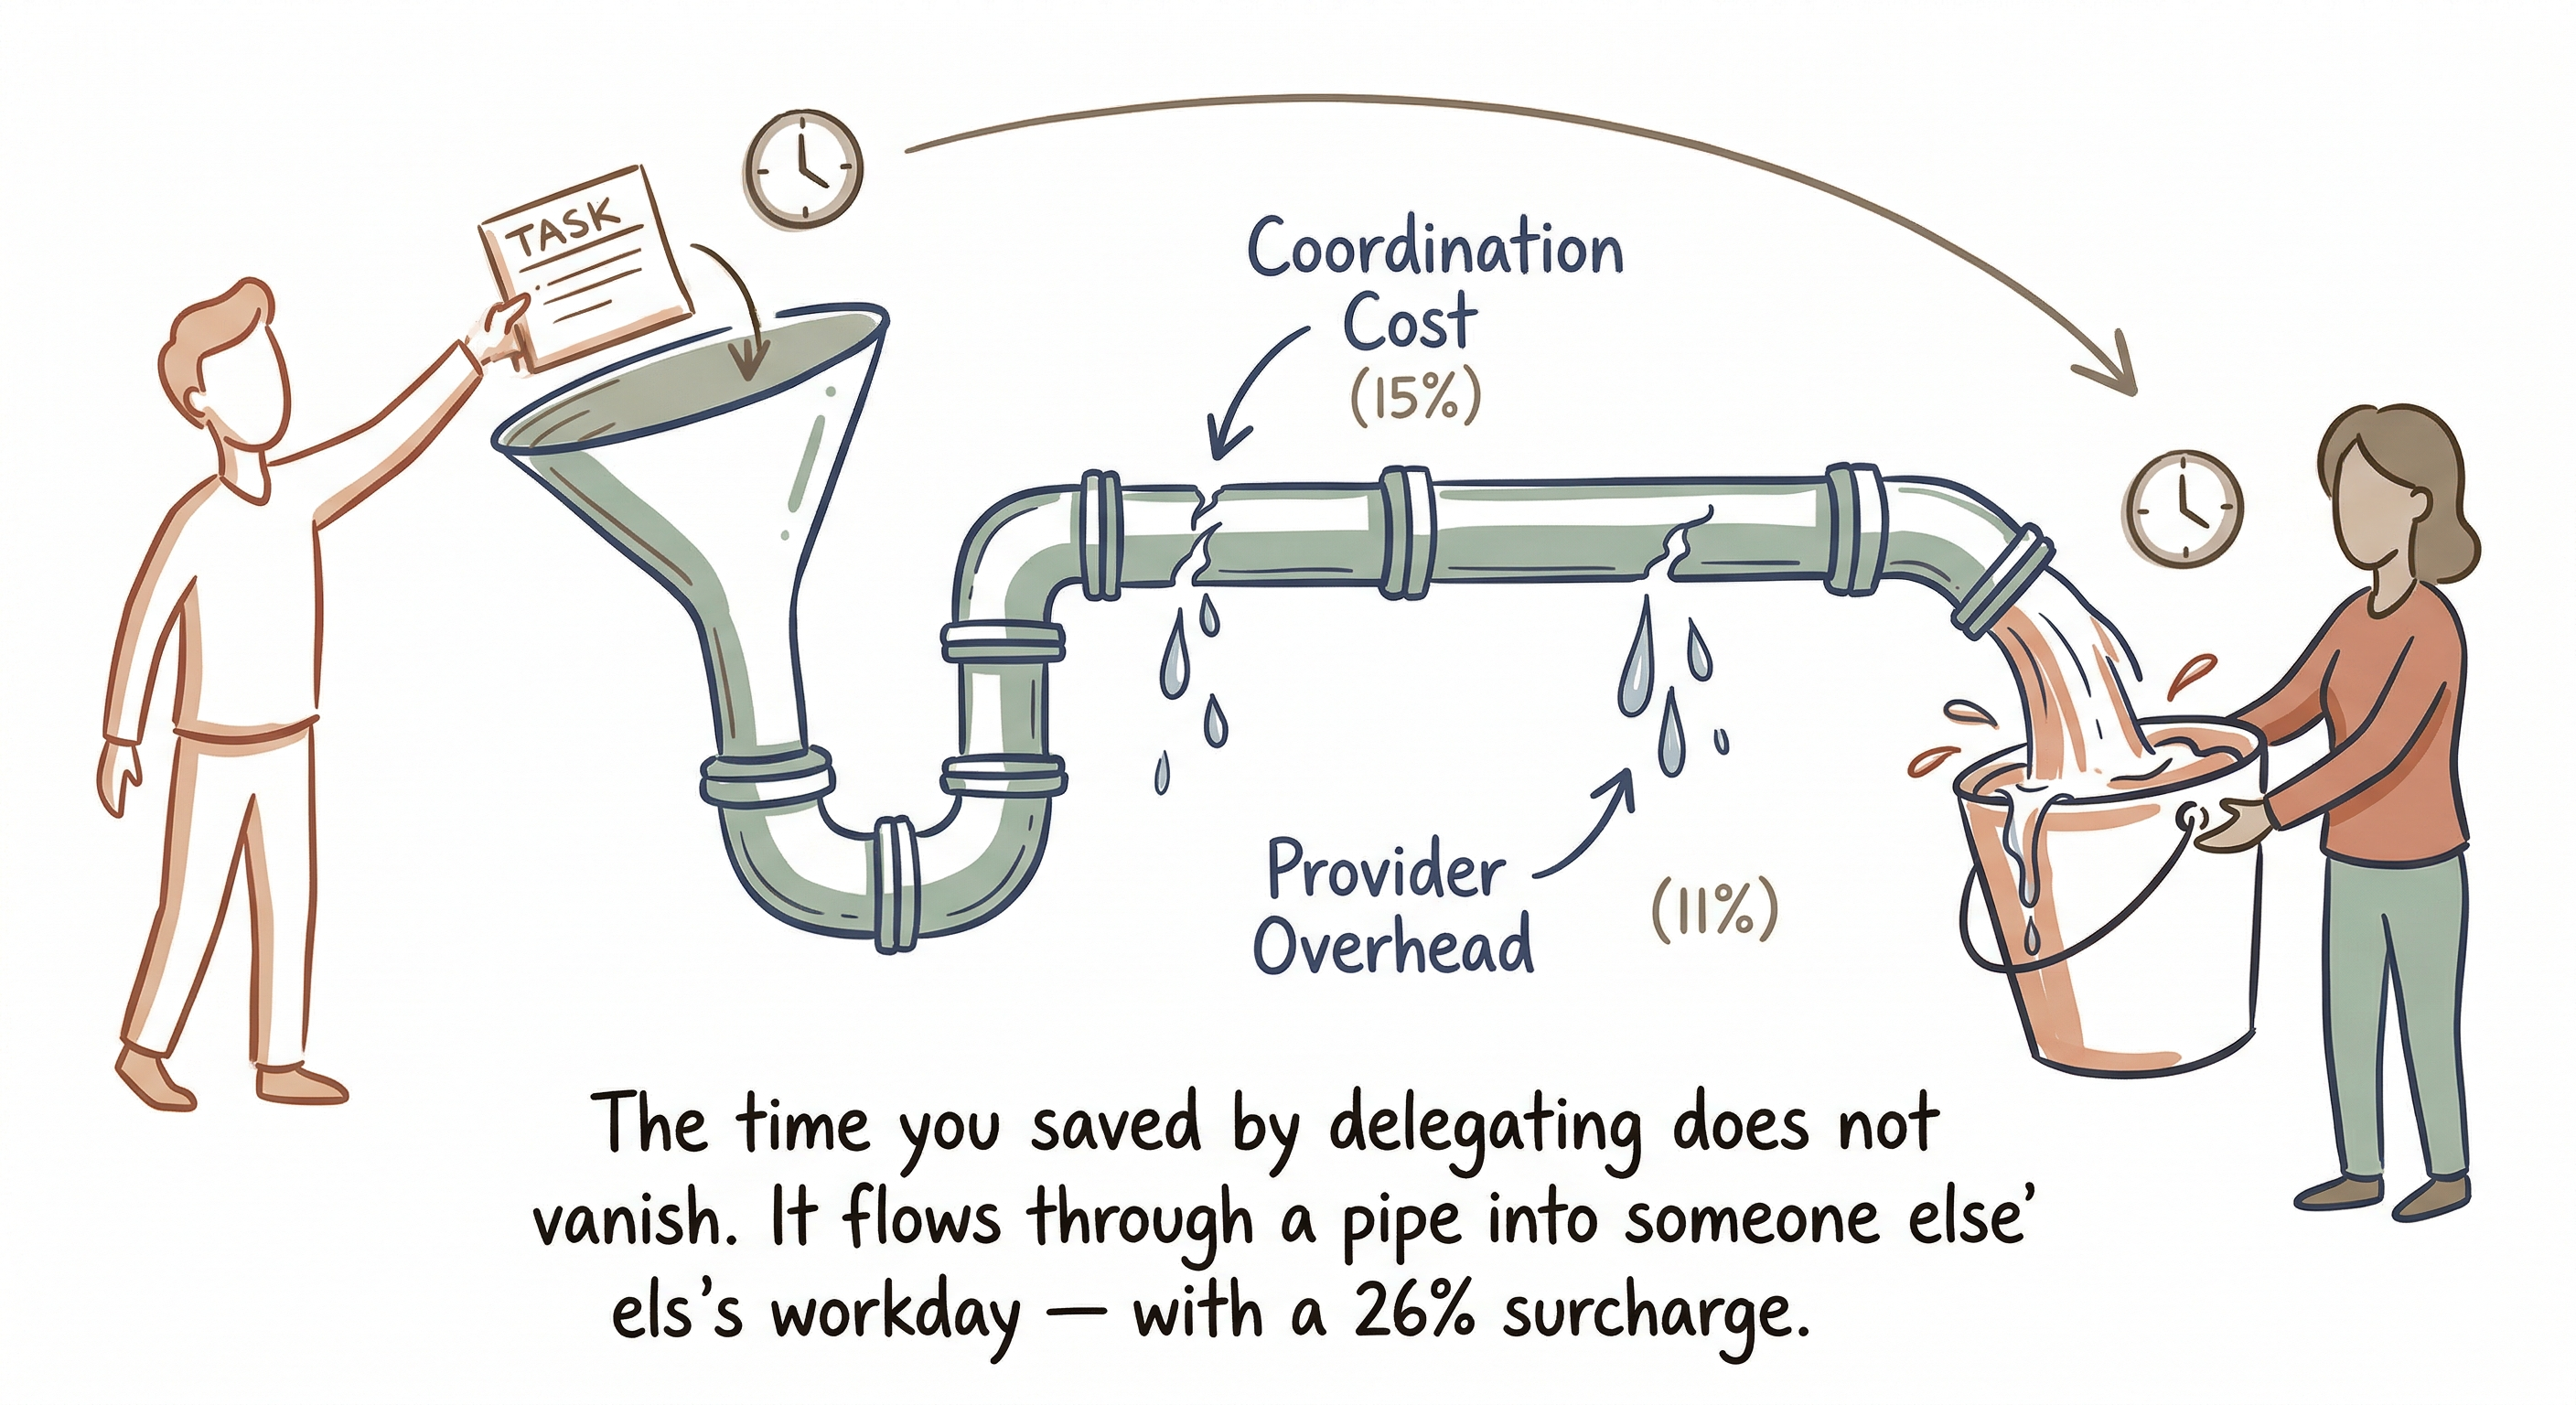
In the companion blog, I asked whether convenience was saving labour or relocating it. In this toy world, the sharper answer is: relocating it, with overhead. At fixed task load, delegation still adds a smaller positive labor premium. Across the full Type A / Type B comparison, that transfer is amplified by the fact that the convenience-oriented world is also busier to begin with. The time you reclaim by outsourcing does not vanish from the system. It reappears as someone else’s workday — slightly larger than what you gave up.
The Cheap Service Trap
Takeaway: Lower prices are not unconditionally beneficial; they relieve stress in slack systems and intensify overload in systems already near capacity.
The previous blog posed another question I kept turning over: is the low price a cause or a consequence of the convenience ecosystem? The model cannot answer this directly — service cost is an exogenous parameter, set by the experimenter, not determined by supply and demand. But it can show us what cheap prices do inside the system once they exist. And what they do turns out to be context-dependent in a way that verbal intuition struggles to anticipate.
Figure 7 — Service cost is conditional: relief at low load, amplification near threshold

At low task loads, cheaper services modestly reduce stress — they make delegation accessible and the system absorbs it easily. At moderate loads, the difference between cheap and expensive services is negligible. But near the threshold band (task load 3.0–3.5), something counterintuitive happens: cheaper services amplify overload. The mechanism is straightforward once you see it: lower prices remove the economic brake on delegation, encouraging more agents to delegate more tasks, which floods the service pool beyond provider capacity. Backlogs build. Stress rises. The very cheapness that was supposed to relieve pressure creates it.
The same lever — lowering price — produces opposite effects depending on where you stand relative to the system’s capacity threshold. Relief below the cliff, amplification above it. This is a hallmark of nonlinear systems, and it is exactly the kind of insight that verbal reasoning alone struggles to produce. You cannot intuit your way through a feedback loop with three interacting variables and a phase transition. You need to run the computation.
Cheap services help below the threshold and hurt near it. That is the kind of reversal nonlinear systems produce.
This finding also reframes a policy intuition that feels obvious: “make services cheaper and people will be better off.” In this model, that is true only when the system has spare capacity. When it does not — when every provider is already close to their time limit — cheaper services are like widening the entrance to a stadium that is already full. More people get through the gate, but the crush inside gets worse.
What the Model Cannot Say
Takeaway: The most useful result here is partly negative: the current mechanism can compare preset worlds and detect thresholds, but it still cannot generate the full norm cascade or causal loop the broader argument ultimately needs.
Here is where I owe you honesty — and where the story becomes, I think, most interesting.
I expected mixed systems — societies starting with moderate delegation preferences around 0.50 — to be unstable. The hypothesis was that social conformity would amplify small random differences: a few agents who happen to delegate more would pull their neighbors toward delegation, creating local clusters that expand, until the whole society tips toward one extreme or the other. A norm cascade. A bifurcation. The middle, unable to hold.
It did not happen. Across a mixed-state parameter space spanning starting delegation preferences from 0.35 to 0.65 and conformity pressures from 0.1 to 0.9, the maximum standard deviation in final delegation rates was only 0.0125 on a 0-to-1 scale. The middle held. Mixed systems stayed mixed. There was no bifurcation, no cascade, no dramatic tipping point in the social norm dimension.
Figure 8 — Mixed-system stability: the middle holds


The two panels show this in different ways. The heatmap says there is no hidden unstable corner in the broader space: across all 30 parameter combinations, dispersion stays low, and the cell-to-cell variation is barely visible. The scatter says the same thing at the run level: final delegation rates cling to the identity line, meaning they end up very close to where they started, even under the strongest conformity setting. This is perhaps the model’s most important finding — and it is a negative one. The current mechanism design cannot produce the norm cascade I anticipated. Why? The conformity mechanism is too symmetric: it pulls toward the local mean equally from both sides, rather than amplifying deviations. The adaptation rate is too slow relative to the simulation horizon. There is no skill decay — agents who stop self-serving do not lose their ability to self-serve. And the starting conditions are still fairly homogeneous, which makes large divergence harder to trigger in the first place. In reality, they might not be. A generation that never cooks may lose the skill entirely, making delegation not a preference but a structural necessity. A neighborhood where every restaurant assumes delivery as the default may see sit-down options disappear, making non-delegation physically harder. Those mechanisms are absent from this model.
Figure 9 — Hypothesis verdict matrix
| hypothesis | judgment | evidence | interpretation |
|---|---|---|---|
| H1 | Strong support (preset level); modest positive equal-load effect | Type B maintains a 30.0% preset-bundle labor premium at 450 steps; with task load aligned, the gap shrinks to ~3–4%. | Convenience-oriented preset bundles use more total labor overall; delegation alone adds a smaller positive premium that grows near the threshold band. |
| H2 | Strong support | Threshold band at task load 3.10, refined to 3.0-3.25. | A narrow overload band precedes the high-backlog regime. |
| H3 | Partial support | Type A retains 3.65h vs 2.46h for Type B. | Autonomy preserves more personal time; convenience is not directly measured. |
| H4 | Partial (important negative) | Max mixed-state std = 0.0125. | Moderate instability, but no dramatic bifurcation under current parameters. |
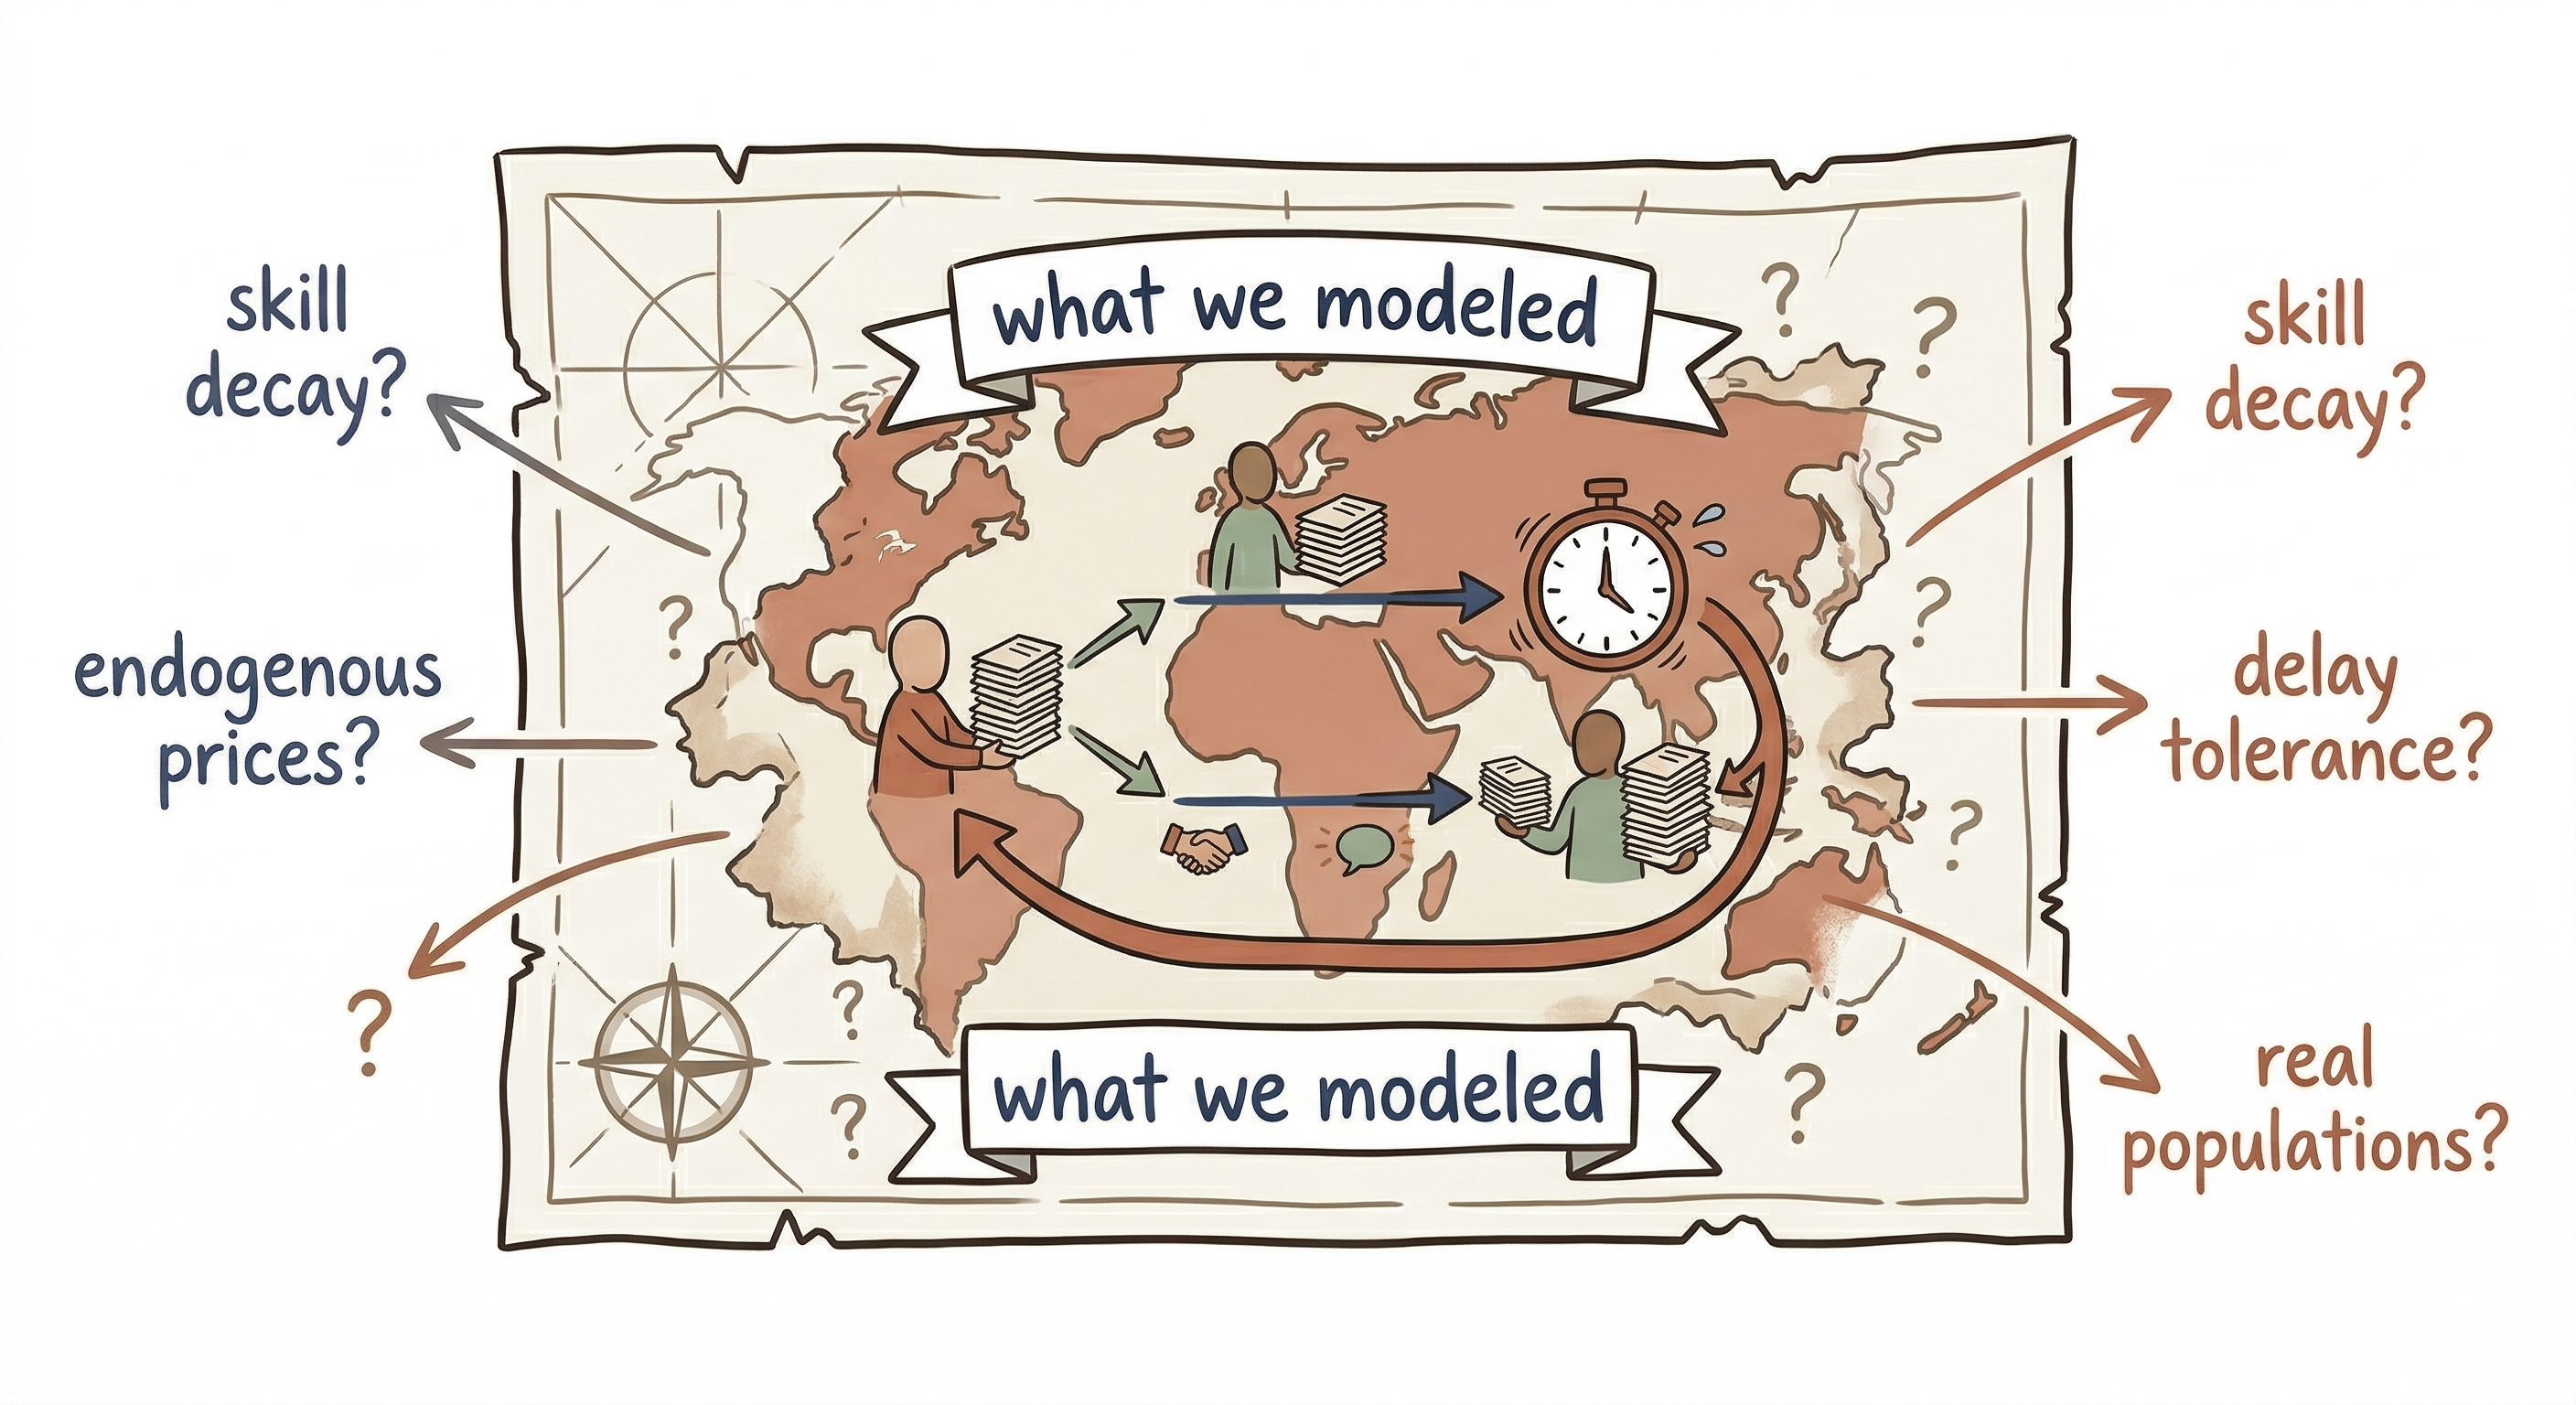
A model that honestly reports what it cannot find is more useful than one that overclaims what it did. This toy world can confidently compare preset worlds. It can show that convenience-oriented bundles use more total labor overall, and that at fixed task load higher delegation is associated with a smaller positive labor premium. It can compare how stress, inequality, and labor composition evolve under different configurations. It can test whether moderate delegation states remain stable under the current rules. But it cannot identify the full causal loop between cheap services and service dependence — because prices are not endogenous. It cannot measure real populations or name specific societies. And it cannot claim that delegation alone explains the full published 30% gap. Skill decay, demographic inequality, and how speed expectations form and harden are simply not in the code.
The boundary between what a model can say and what it cannot is not a weakness to hide. It is the most informative part of the map.
Back to the Supermarket
Takeaway: The toy world does not settle the real-world debate, but it turns a vague intuition about convenience into a clearer map of labor premiums, thresholds, overheads, and missing mechanisms.
I started this exploration standing in front of a closed door on a Sunday afternoon, grocery bag in hand, feeling a small friction. That friction turned out to be a thread — and the thread led here, to a toy world where 100 agents navigate the same tension between doing things yourself and having someone else do them for you.
What did the toy world teach me?
Five points stood out:
- Convenience-oriented preset bundles are not free. In this model, they generate about 30% more total labor than autonomy-oriented ones — a structural premium that appears immediately and persists indefinitely. But most of that dramatic gap belongs to the whole preset bundle, not to delegation alone: the convenience world is also busier to begin with, and once task load is aligned the remaining delegation premium is much smaller, on the order of 3–4%.
- There is a narrow threshold separating manageable systems from catastrophic spirals. The transition is a cliff, not a slope.
- Convenience reshapes the composition of labor before it overloads the system. Self-service drops from 89% to 31% of total work, and the gap is filled with service labor and coordination overhead that did not previously exist.
- Cheap services help until they do not. Near the threshold, lower prices amplify the very overload they were meant to relieve.
- The norm cascade I expected did not materialize. That negative result points honestly toward the mechanisms I still need to build.
These are not conclusions about the real world. They are conclusions about a toy world with stated rules and known limitations — a world where providers never specialize, prices never change, and no one ever forgets how to cook. Reality is messier, richer, and more surprising than any model I can build on a laptop.
But the toy world gave me something the previous blog post could not: a vocabulary for the dynamics I observed. Feedback loops with names. Thresholds with coordinates. Labor budgets with ledgers. A way to say, more precisely, that the published 30% gap belongs to an entire architecture — a busier world whose tasks are then routed through coordination costs and provider inefficiency — rather than vaguely gesturing at “hidden costs of convenience.”
More importantly, it taught me what questions to ask next. The norm cascade that did not appear tells me the model needs skill decay — the realistic possibility that a generation which outsources everything gradually loses the ability to do things themselves, turning choice into dependency. It needs endogenous prices — markets that respond to demand, creating the circular causality between cheap services and service dependence that my previous blog post described. It needs delay tolerance — the mechanism by which societies develop speed expectations that, once established, make slower alternatives feel unacceptable even when they are available.
When I stood in front of that closed supermarket door, I was seeing the surface of a system. Now I can sketch what might be underneath. The sketch is rough, the edges are torn, and the most interesting territories — the ones where culture, infrastructure, and individual habit reinforce each other until the system feels like nature rather than design — remain just beyond the map.
That is not a failure. That is where the next model begins.
This model explores abstract social dynamics and is not intended to characterize or evaluate any specific society, culture, or nation. All experiments use abstract Type A / Type B labels. The simulation engine, data, and analysis code are available in the project repository. For the detailed formal report of the experimental methodology and complete results, see the companion research report.
*Built with Mesa (Python ABM framework) · 14,656 simulation runs · 4 research packages