<?xml version="1.0" encoding="utf-8"?><feed xmlns="http://www.w3.org/2005/Atom" xml:lang="en-US"><generator uri="https://jekyllrb.com/" version="4.3.4">Jekyll</generator><link href="https://stevenbush.github.io/Social-Complexity-Insights/feed.xml" rel="self" type="application/atom+xml" /><link href="https://stevenbush.github.io/Social-Complexity-Insights/" rel="alternate" type="text/html" hreflang="en-US" /><updated>2026-04-05T09:19:25+08:00</updated><id>https://stevenbush.github.io/Social-Complexity-Insights/feed.xml</id><title type="html">Social Complexity Insights</title><subtitle>Observations and simulations at the intersection of computational modeling and social dynamics.</subtitle><author><name>Jiyuan Shi</name></author><entry><title type="html">Building an Interface for Simulated Societies</title><link href="https://stevenbush.github.io/Social-Complexity-Insights/2026/04/04/building-interface-for-simulated-societies/" rel="alternate" type="text/html" title="Building an Interface for Simulated Societies" /><published>2026-04-04T00:00:00+08:00</published><updated>2026-04-04T00:00:00+08:00</updated><id>https://stevenbush.github.io/Social-Complexity-Insights/2026/04/04/building-interface-for-simulated-societies</id><content type="html" xml:base="https://stevenbush.github.io/Social-Complexity-Insights/2026/04/04/building-interface-for-simulated-societies/"><![CDATA[<h2 id="opening-hook">Opening Hook</h2>

<p>For a while, my workflow for this project looked like a familiar research loop: edit a parameter in code, launch a batch run, wait for the results, open a static figure, and try to reconstruct what had just happened. That workflow was productive, but it had a hard ceiling. It could tell me what the model produced. It was much worse at helping me inspect why a pattern emerged, what assumptions shaped it, and how I could explain the result to someone who had not lived inside the codebase.</p>

<p>
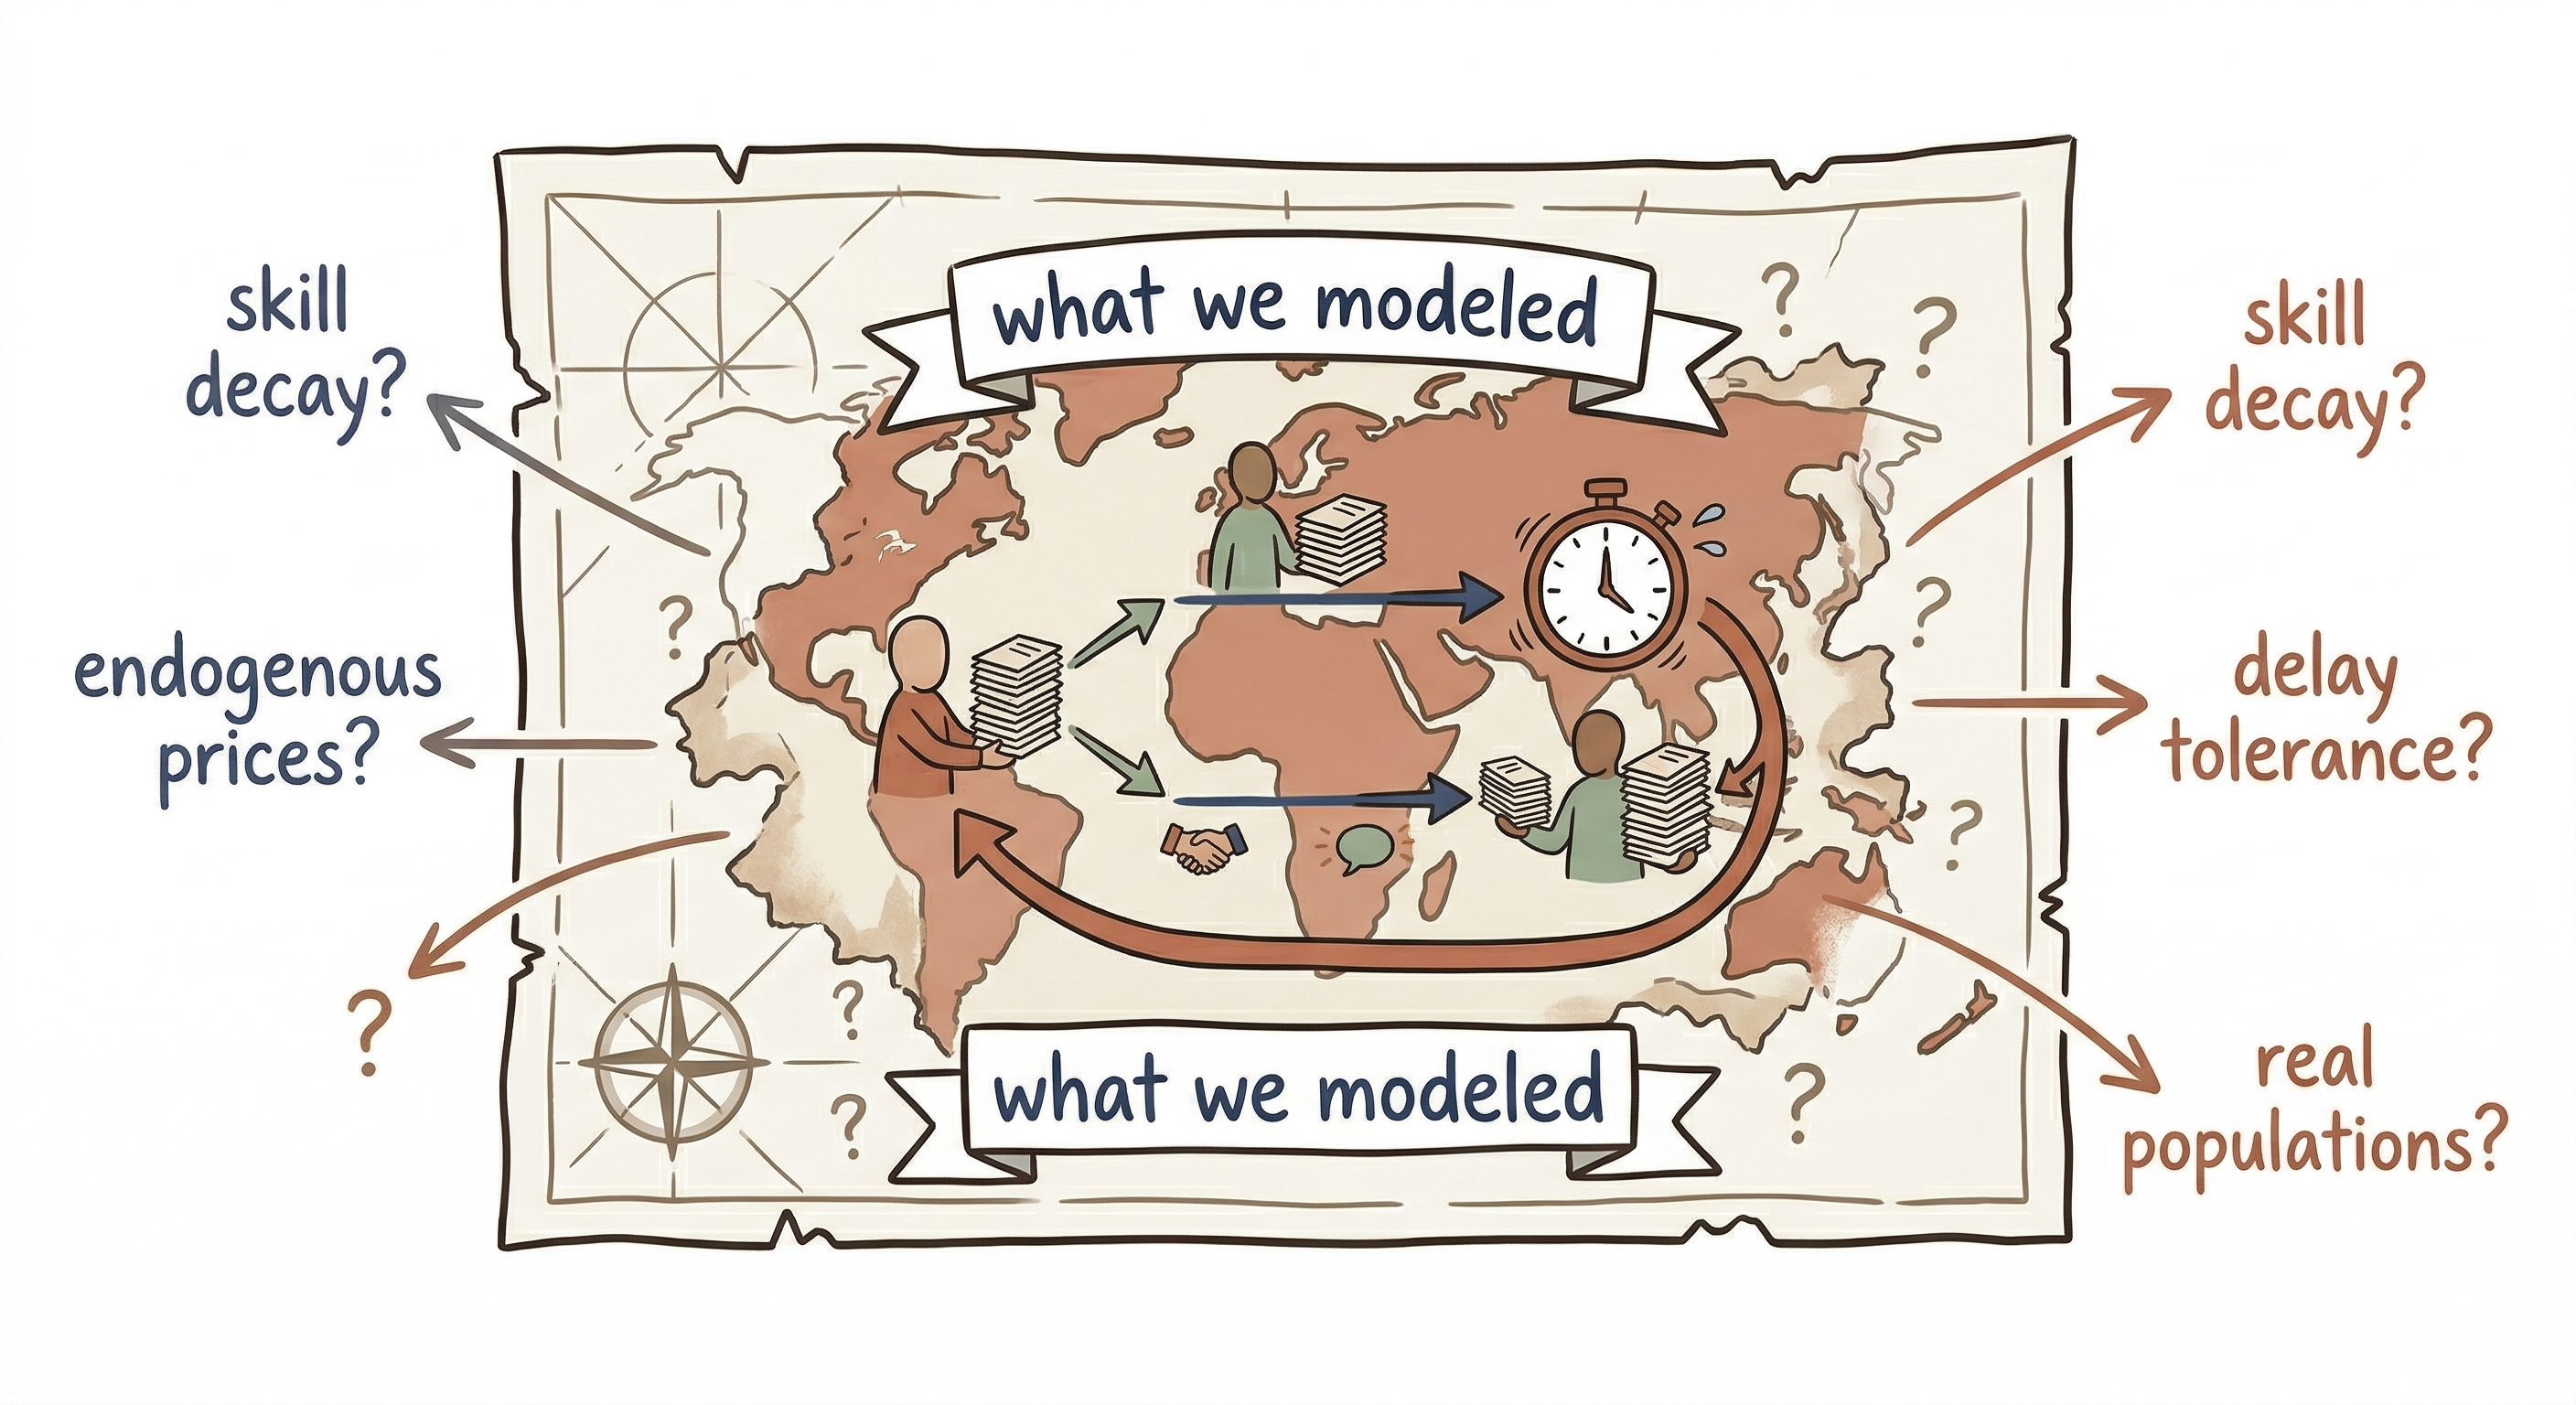
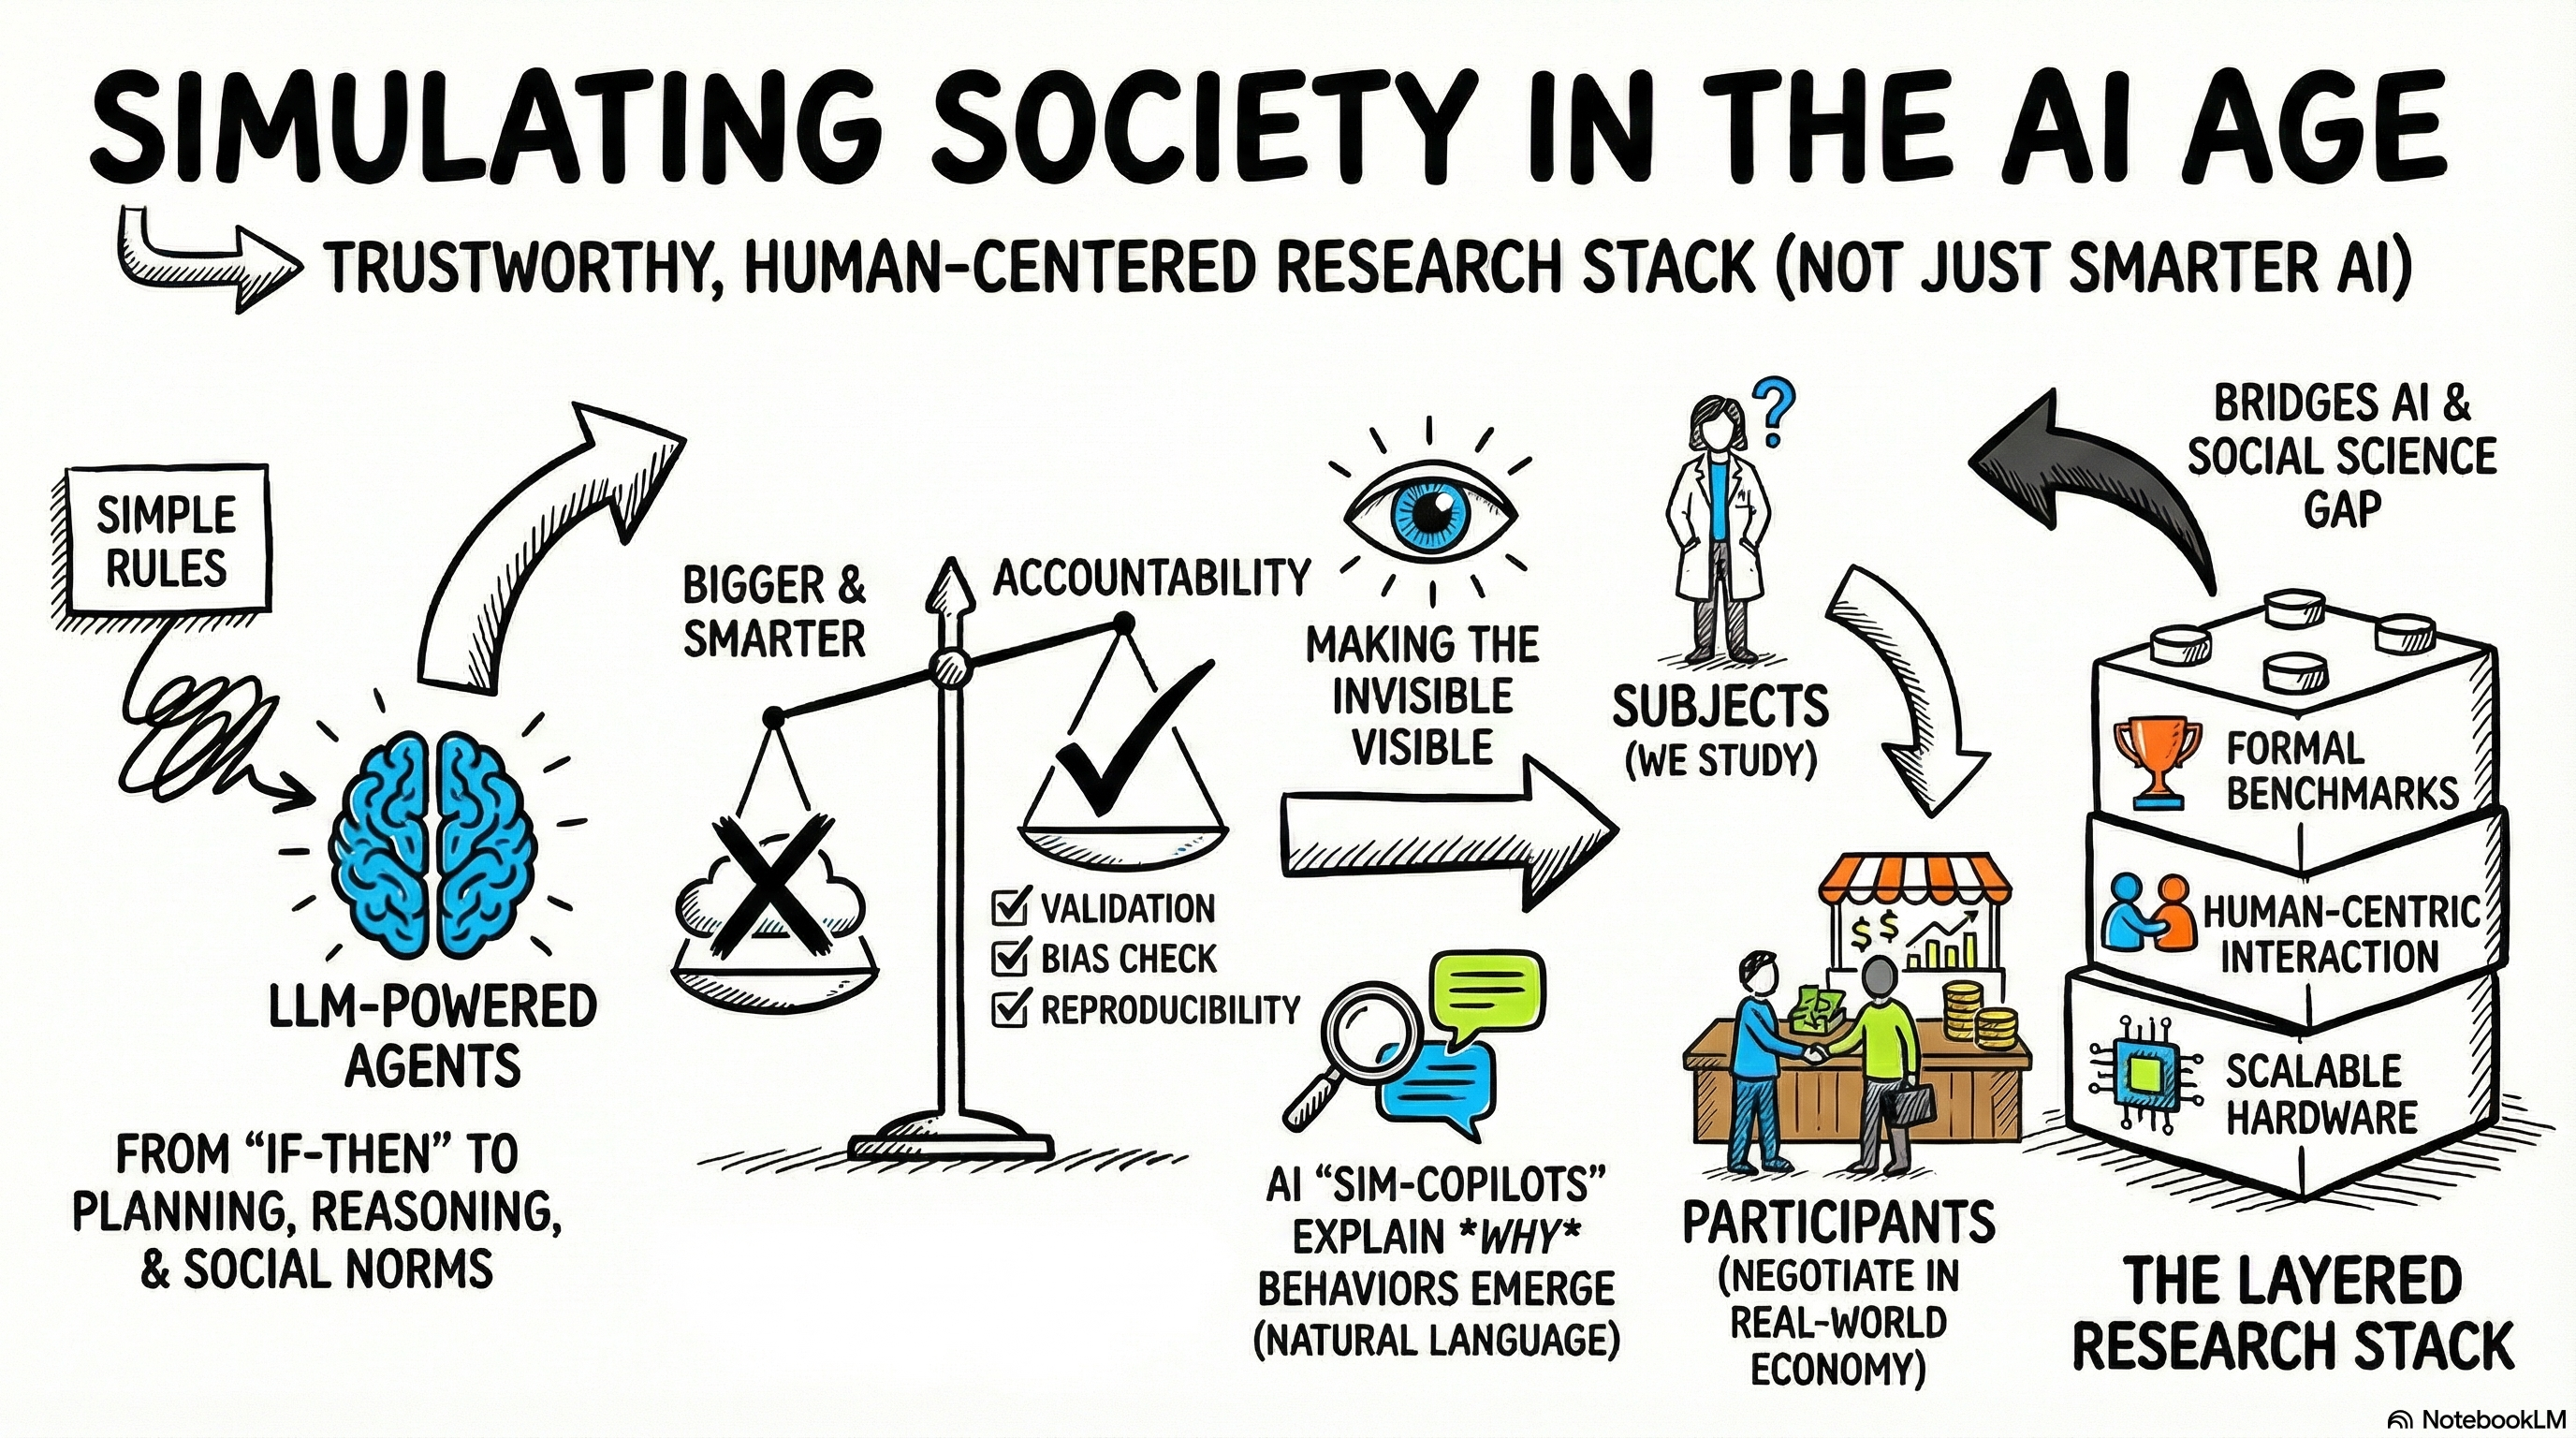
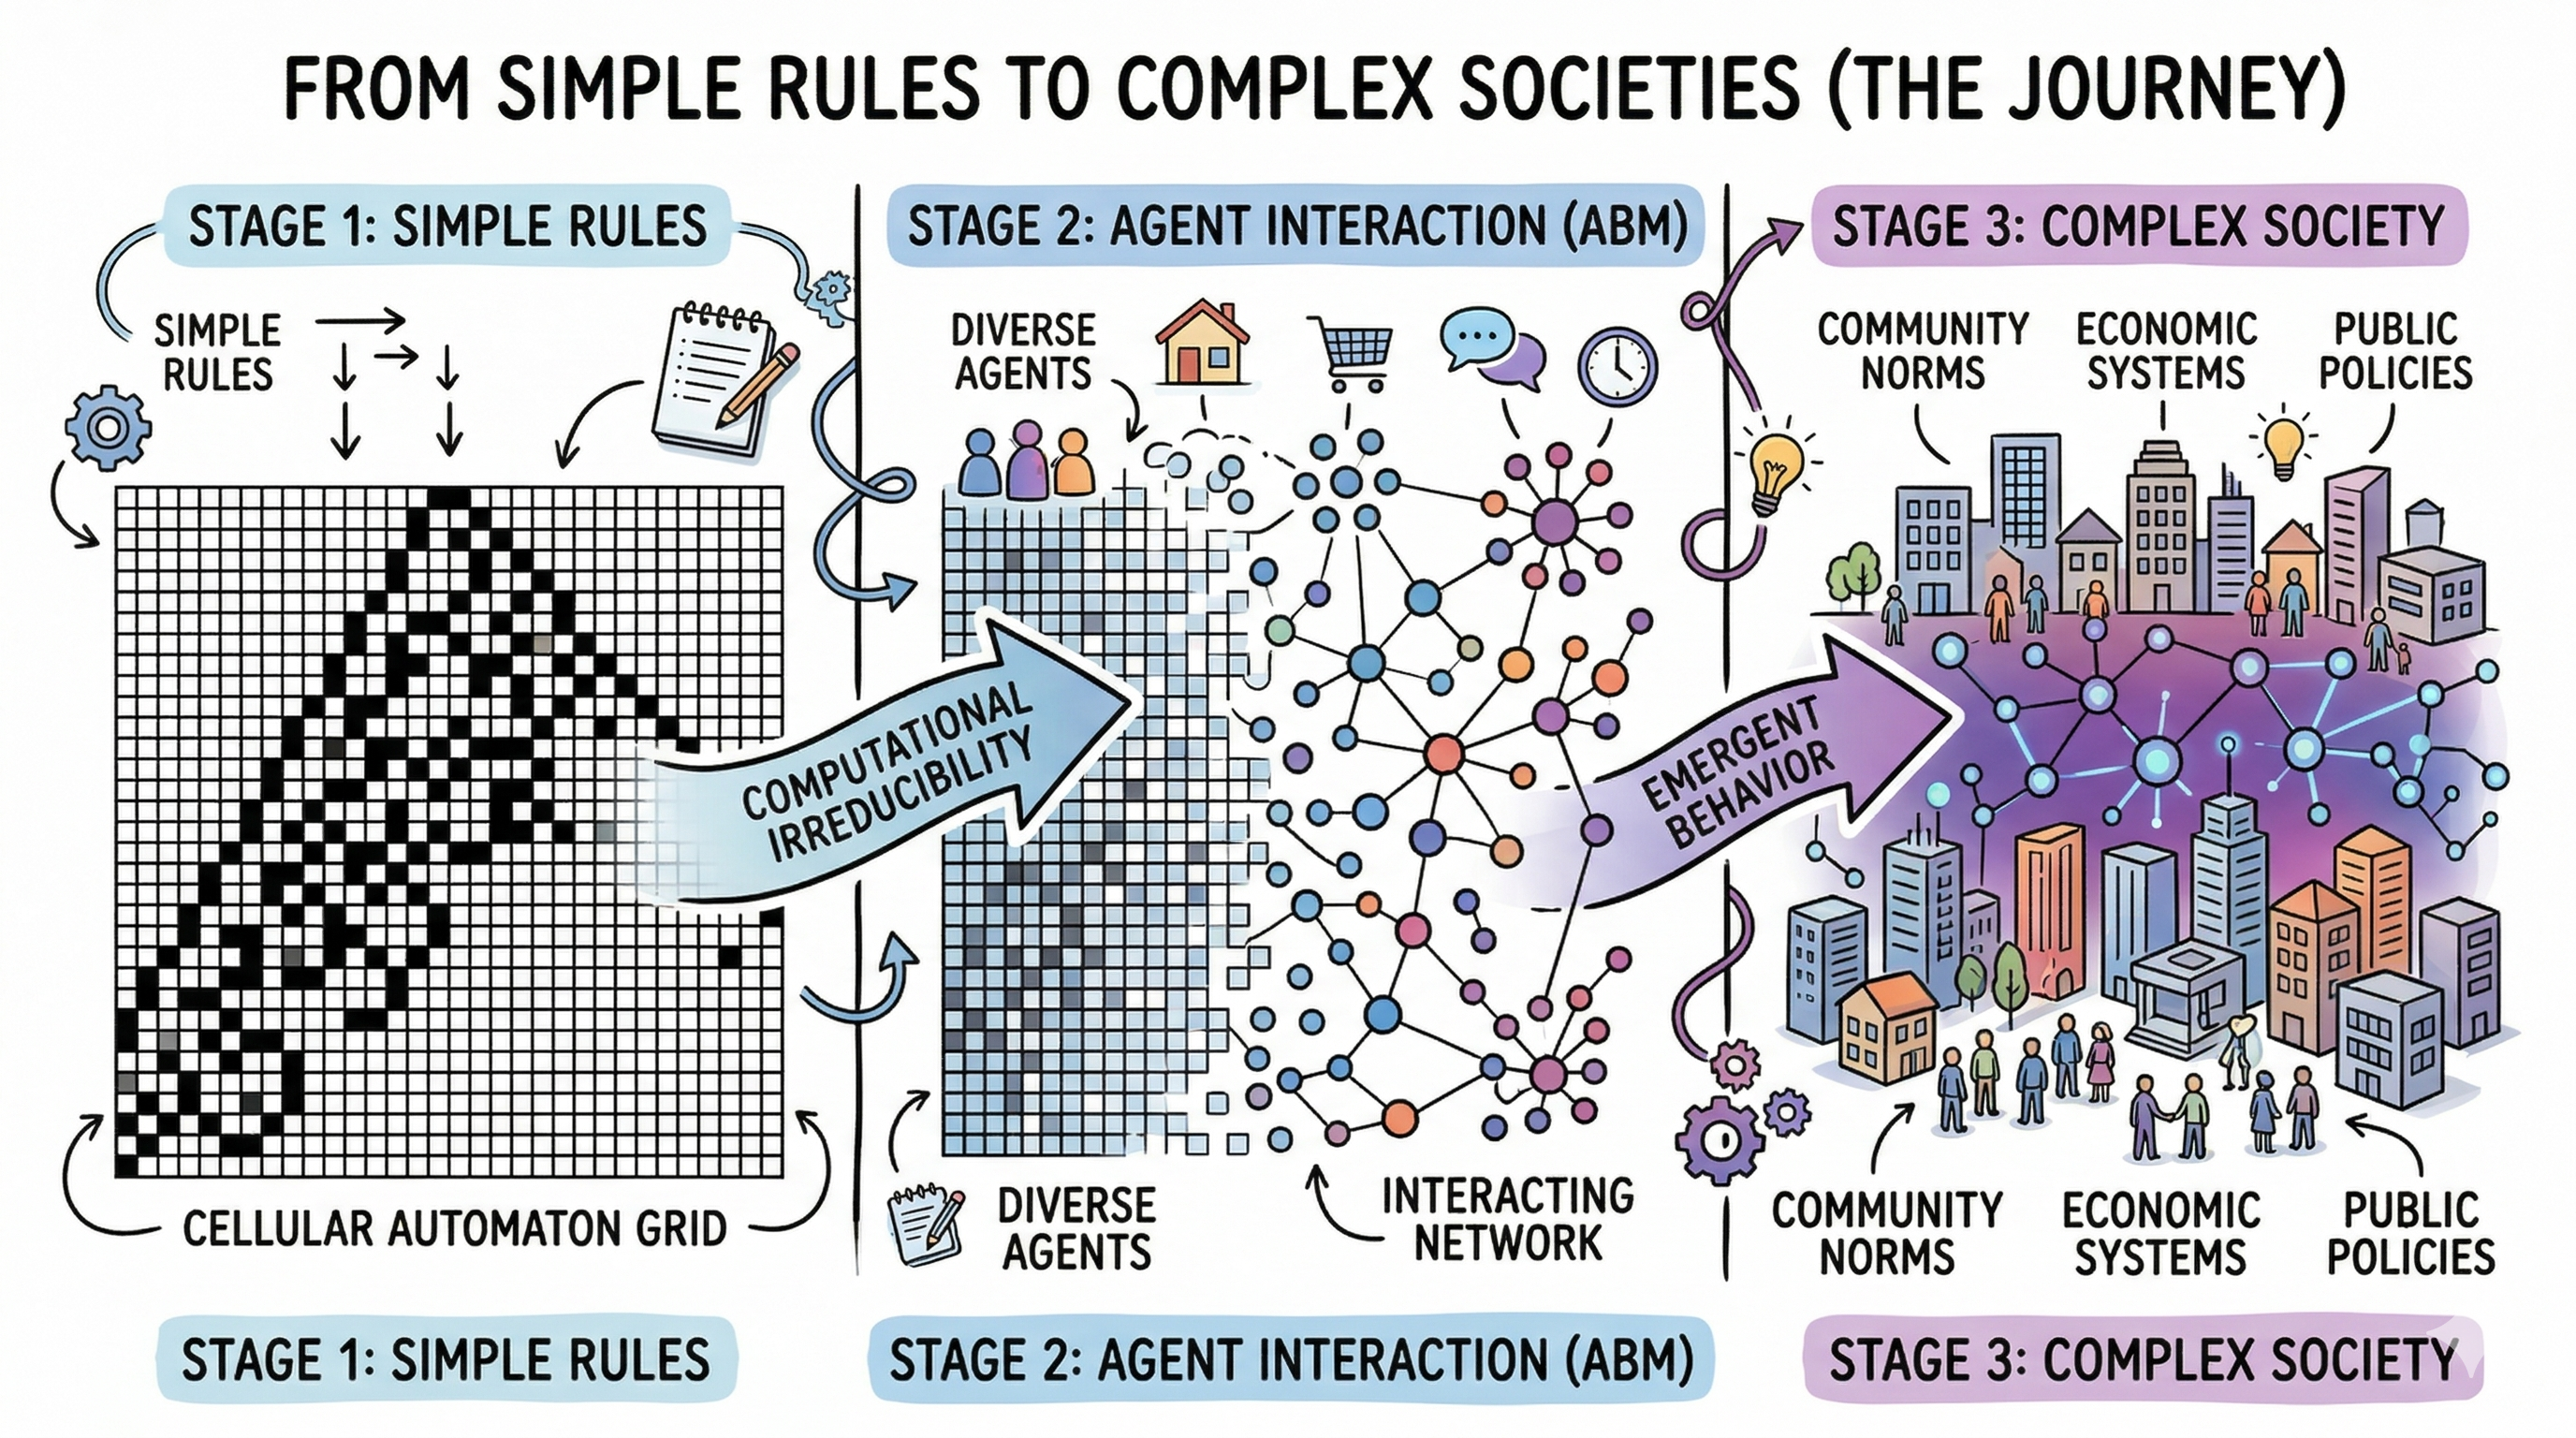
That gap matters more than it sounds. Agent-based modeling is not only about computation. It is also about making mechanism legible. In an earlier essay, <a href="https://stevenbush.github.io/Social-Complexity-Insights/2026/03/31/simulating-society-age-of-ai/"><em>Simulating Society in the Age of AI</em></a>, I described this as a version of “making the invisible visible”: not just plotting outcomes, but exposing how rules, parameters, and interpretation pathways fit together. Once I started treating the interface itself as part of the research instrument, the dashboard stopped being a presentation layer and became part of the methodology.
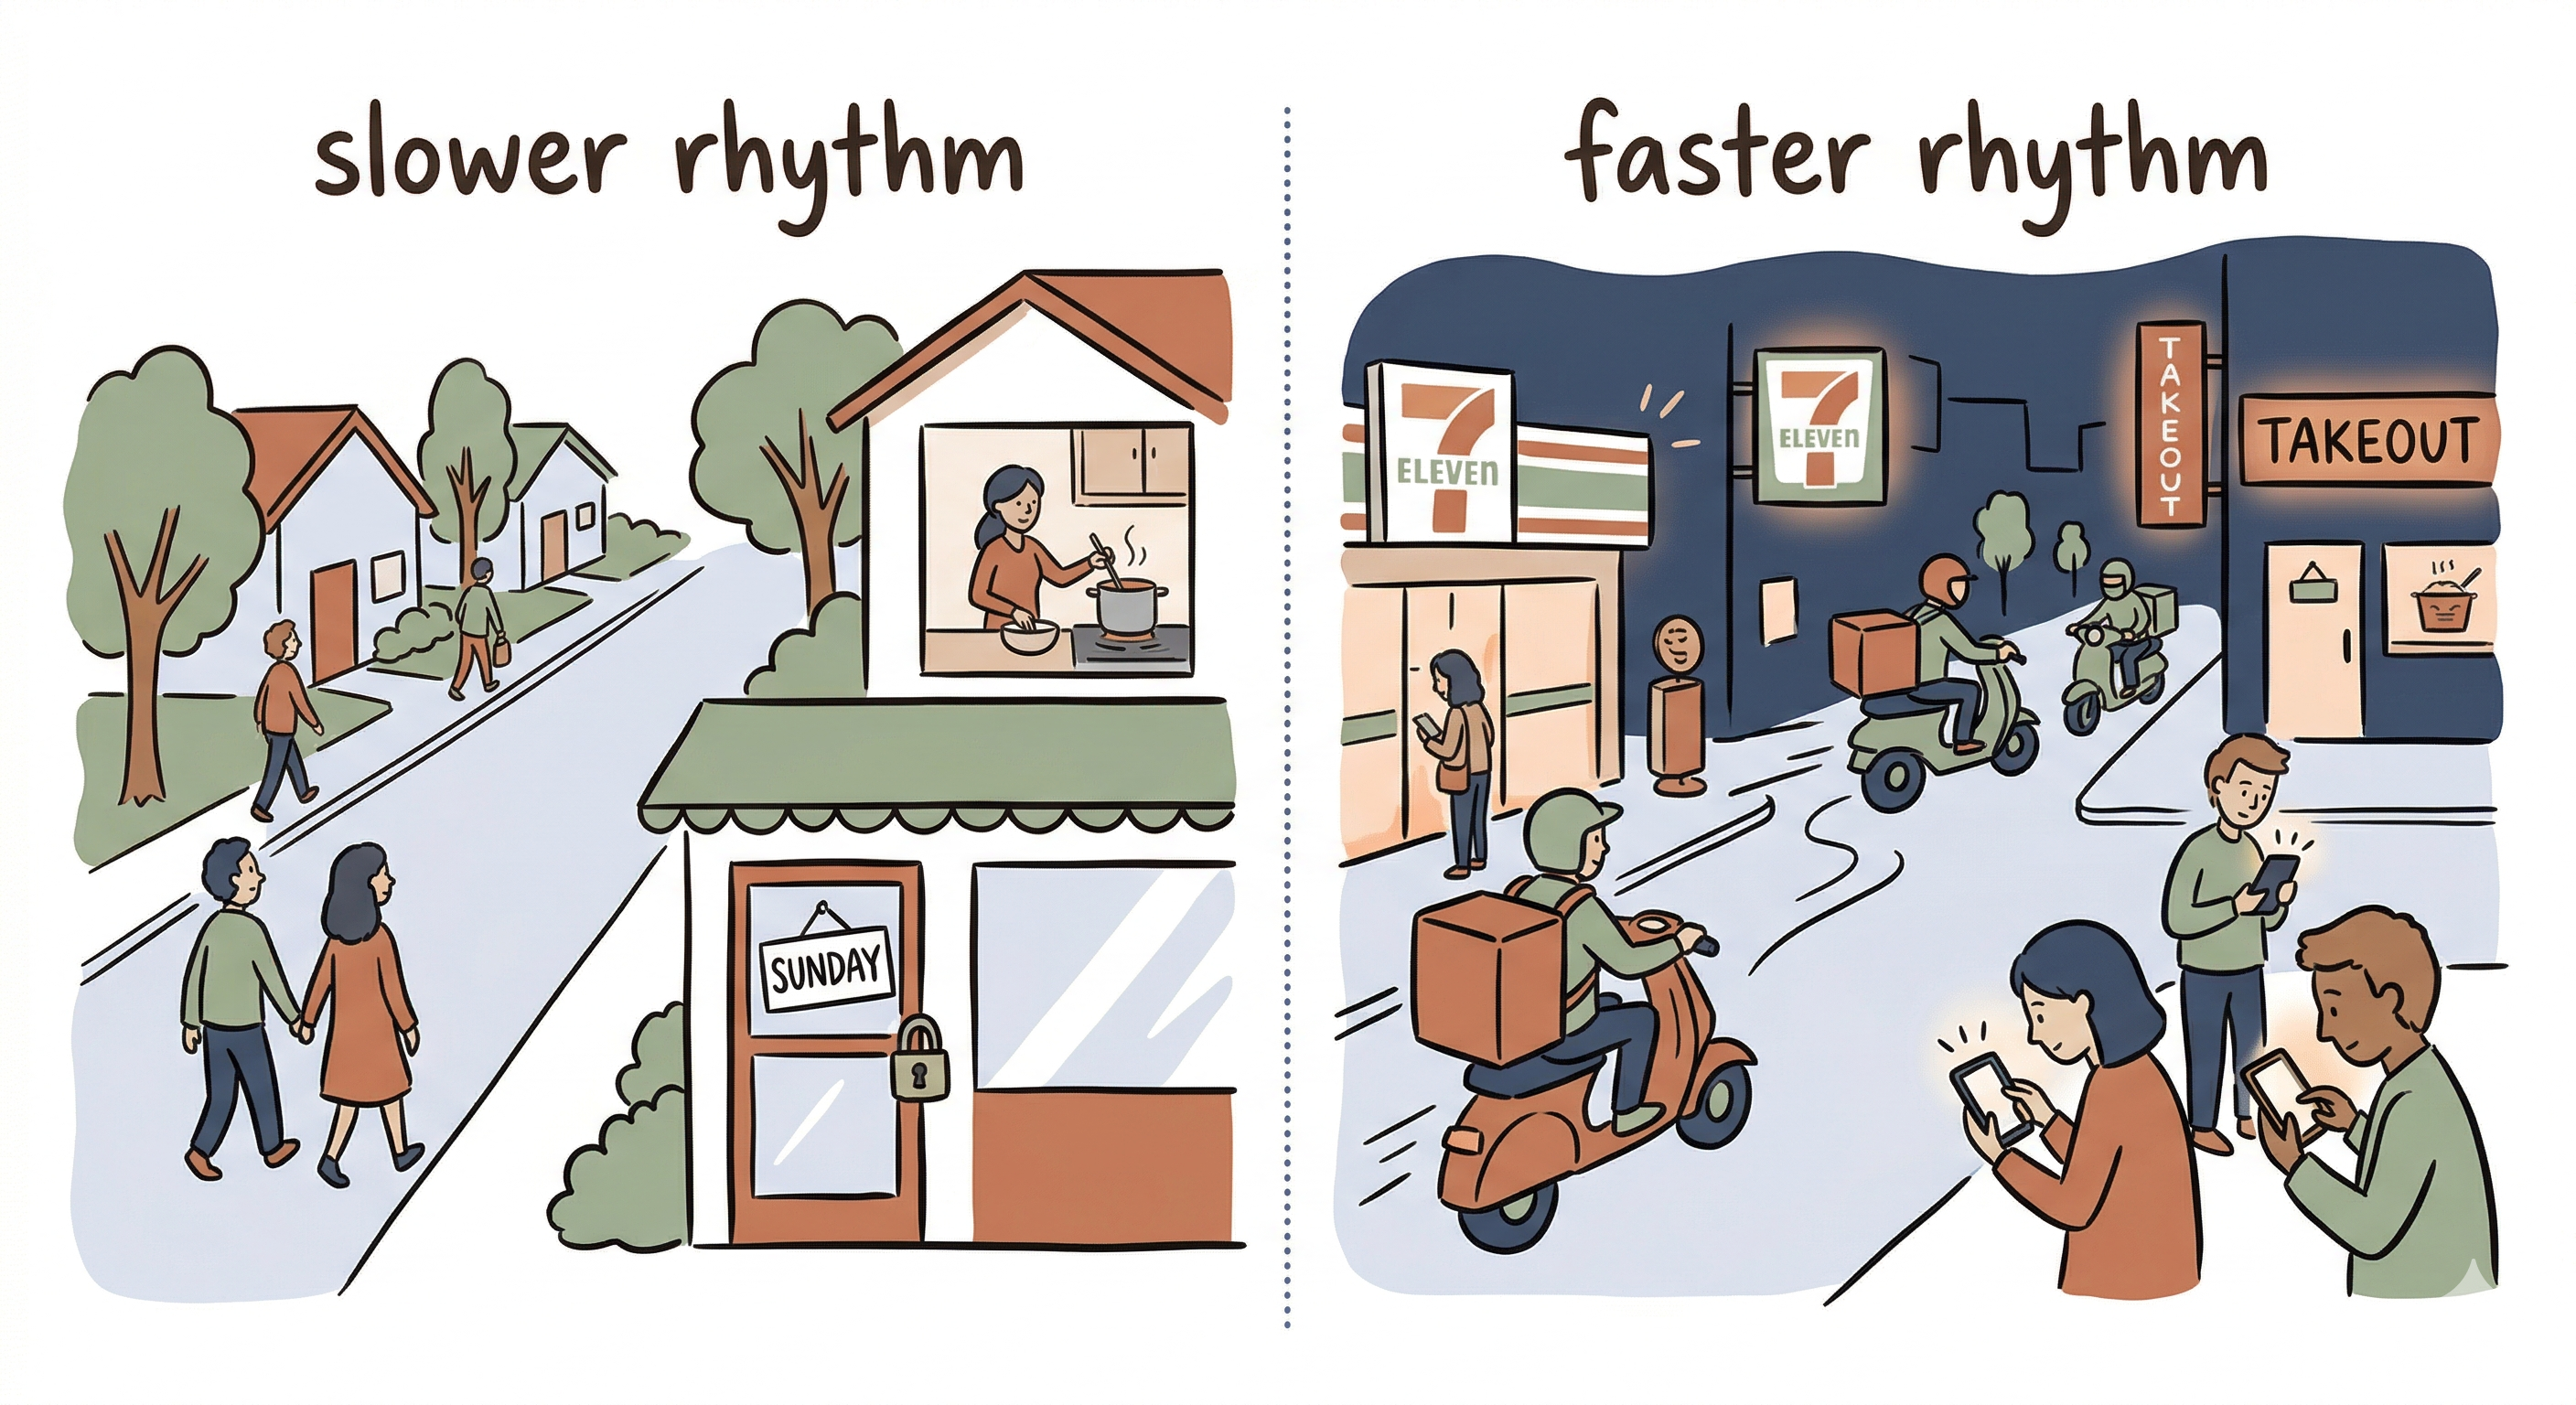
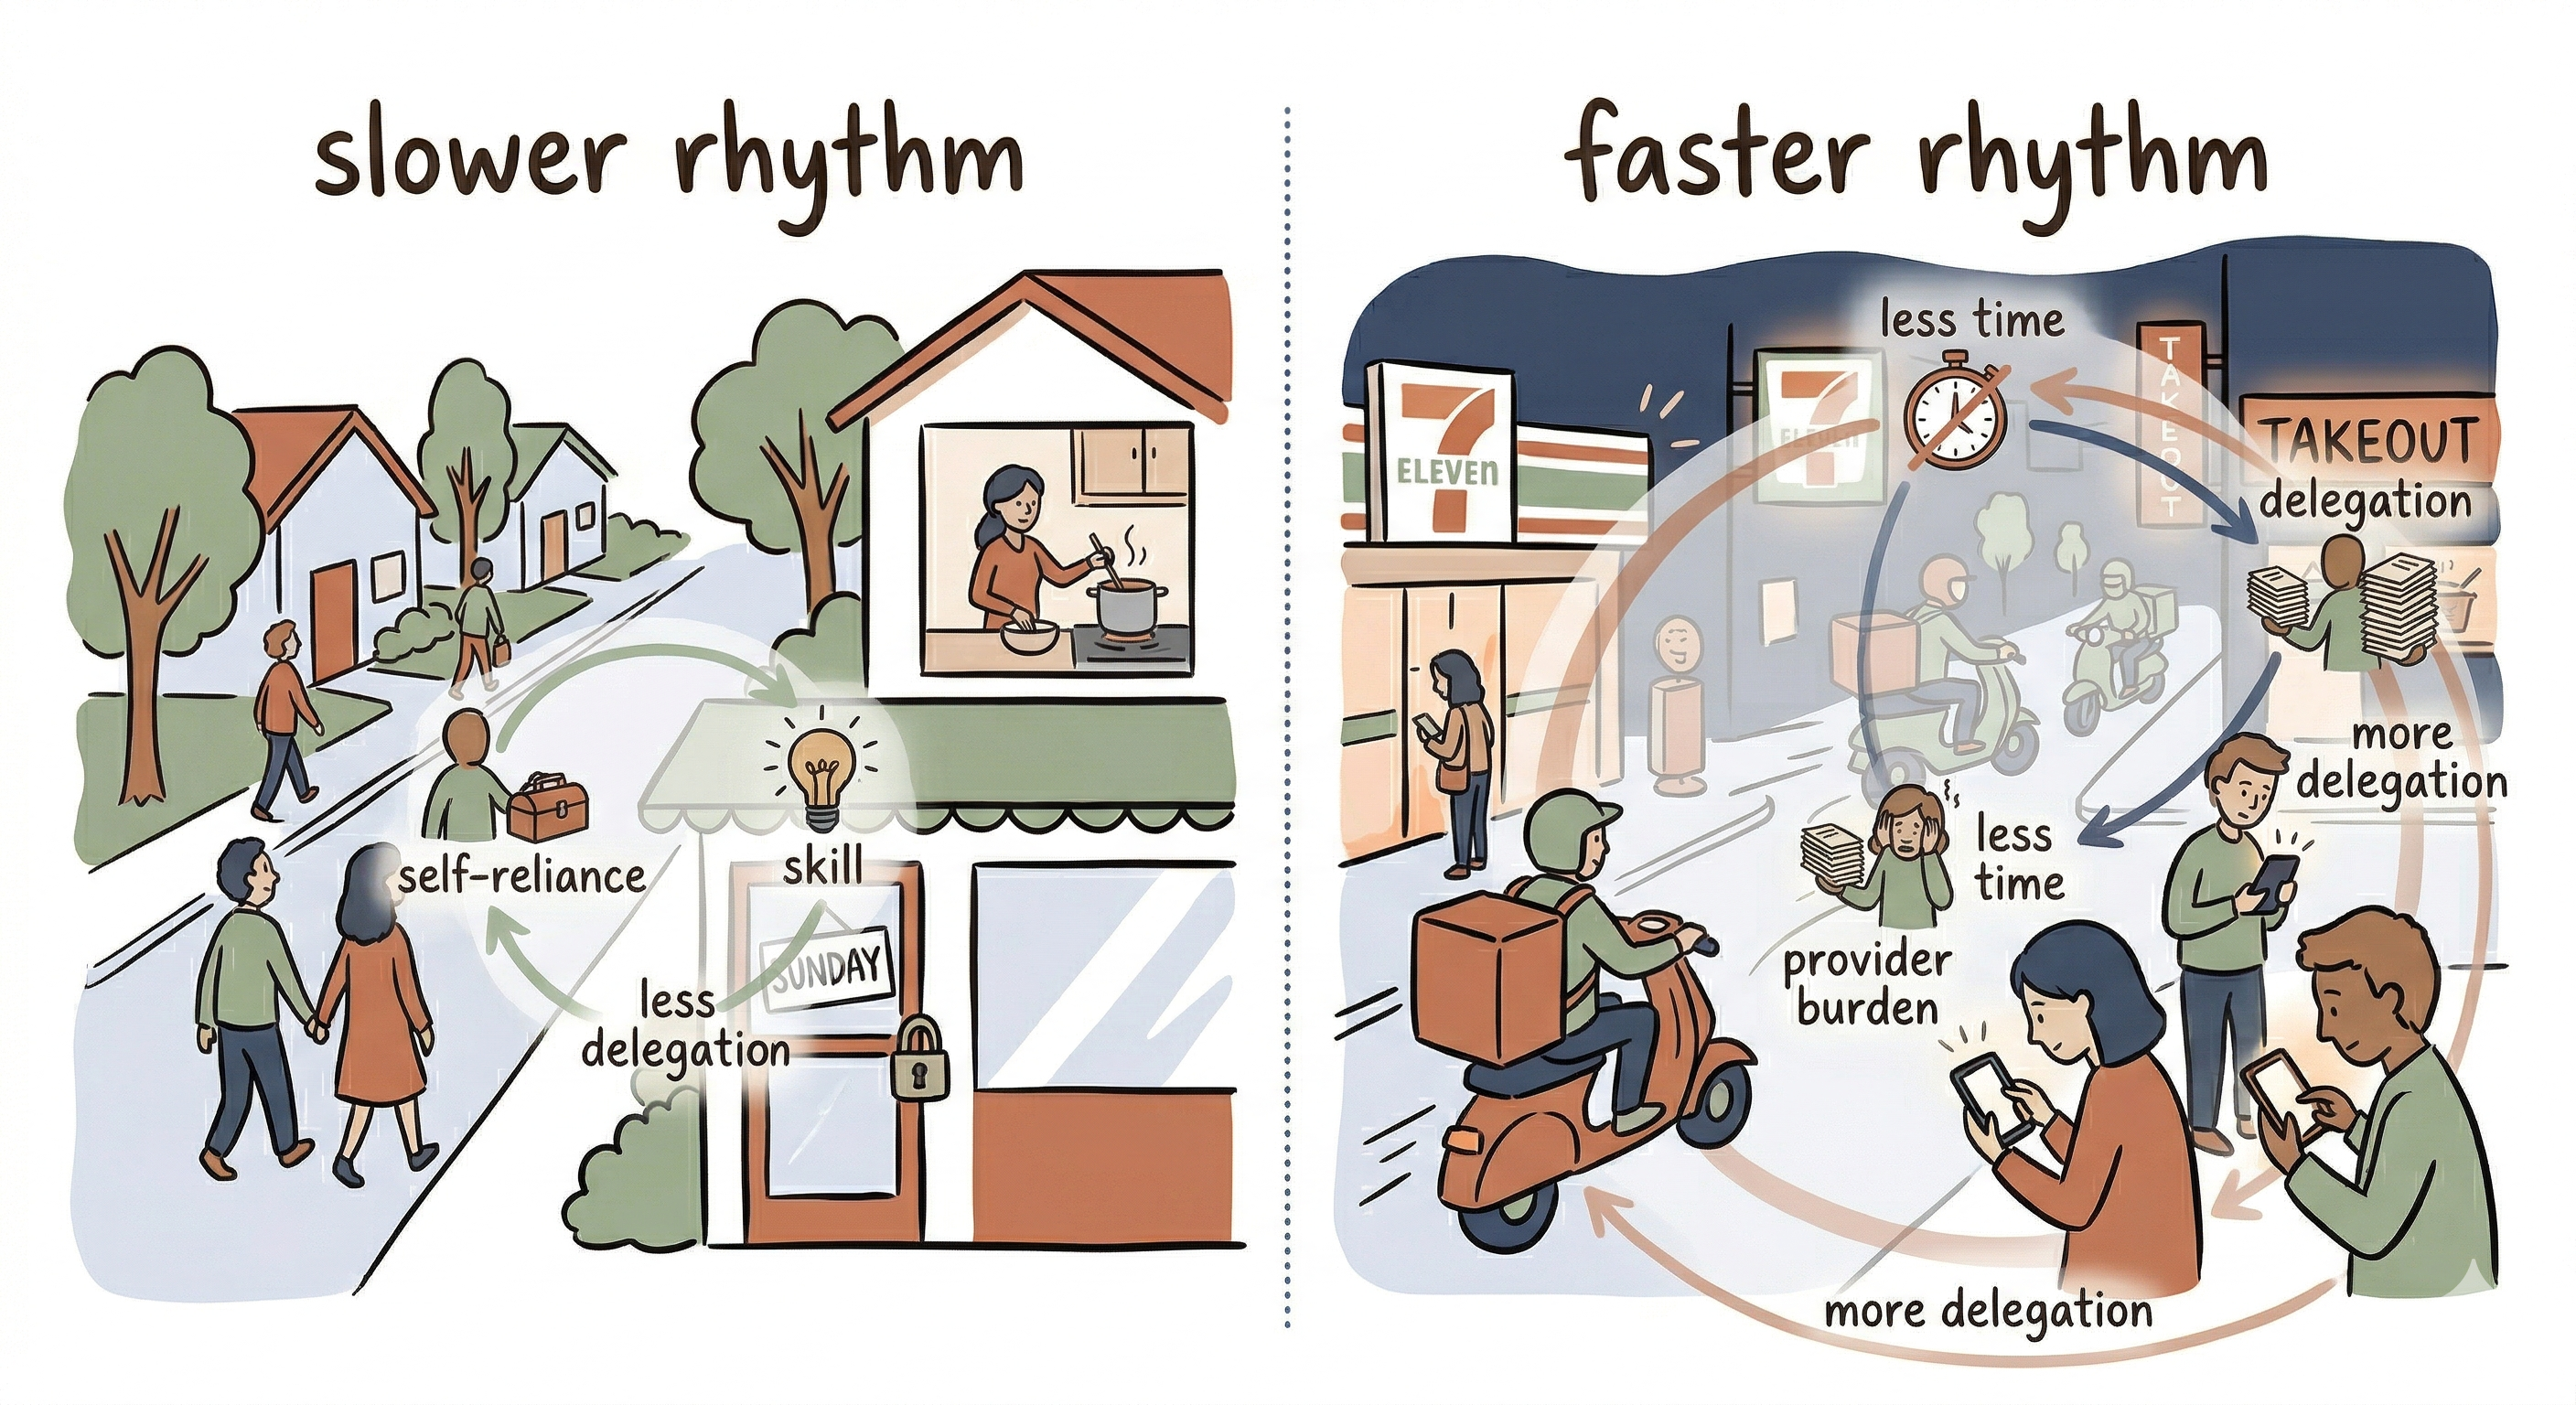
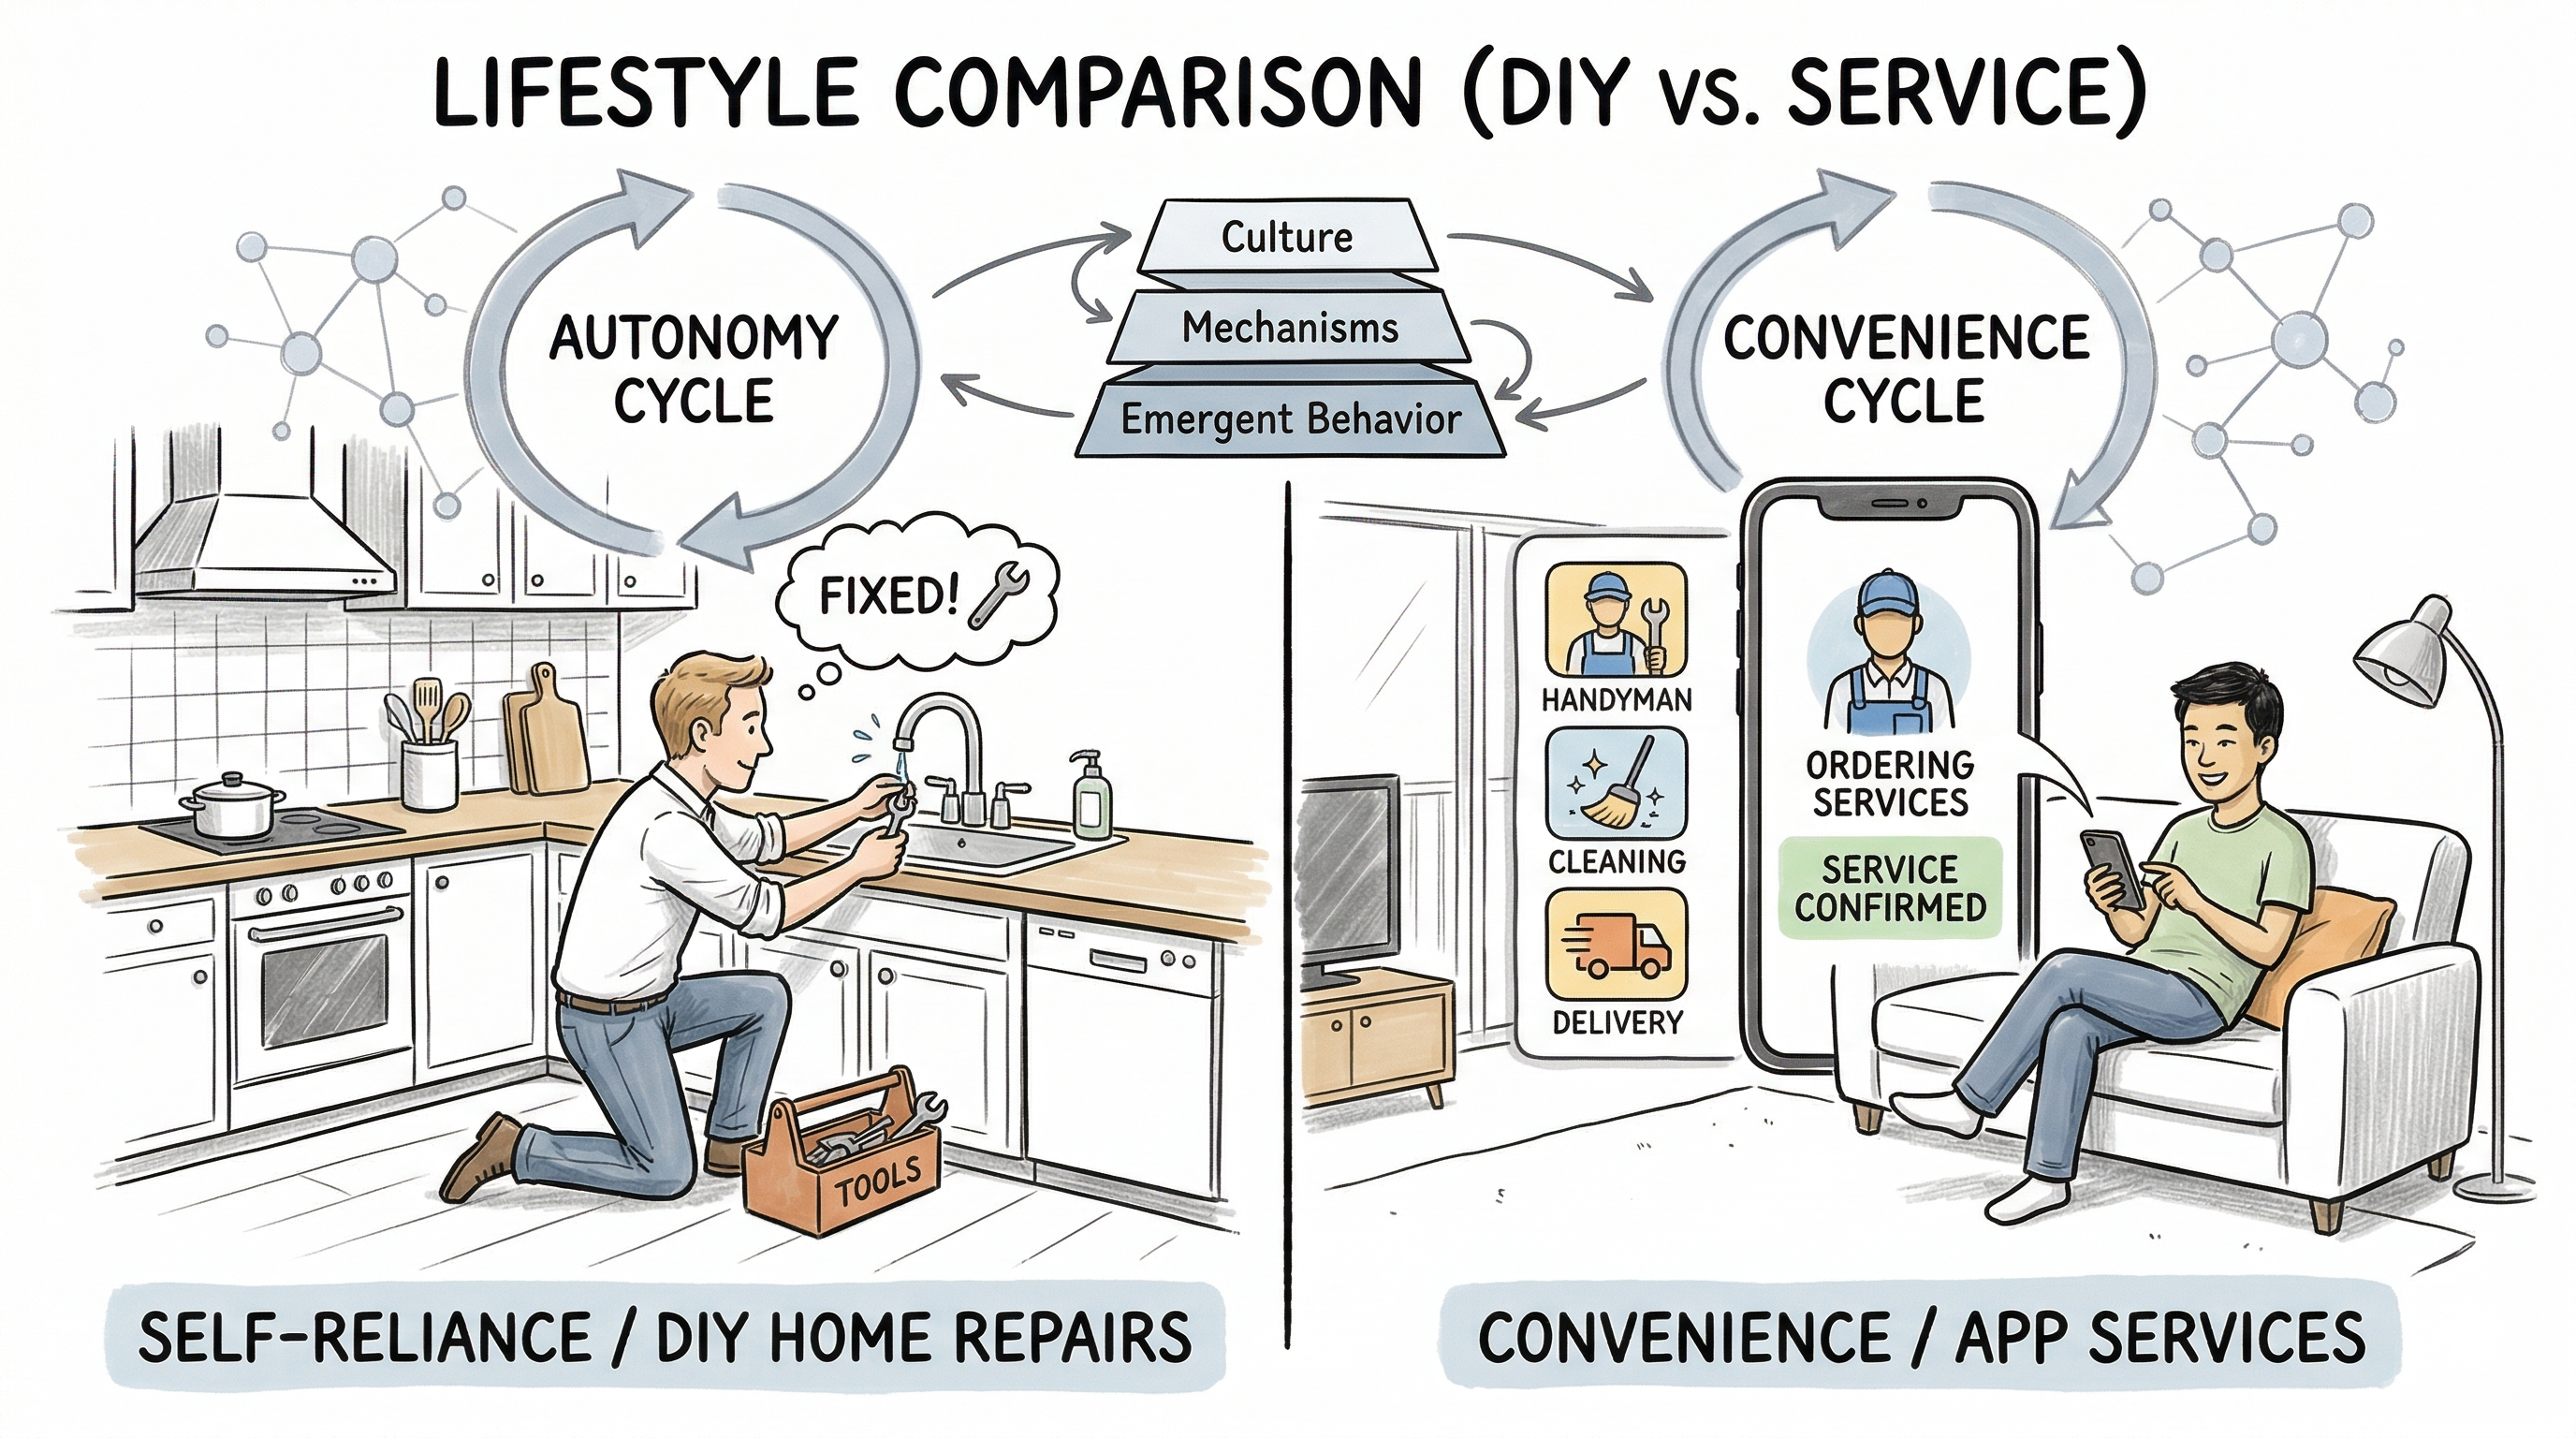
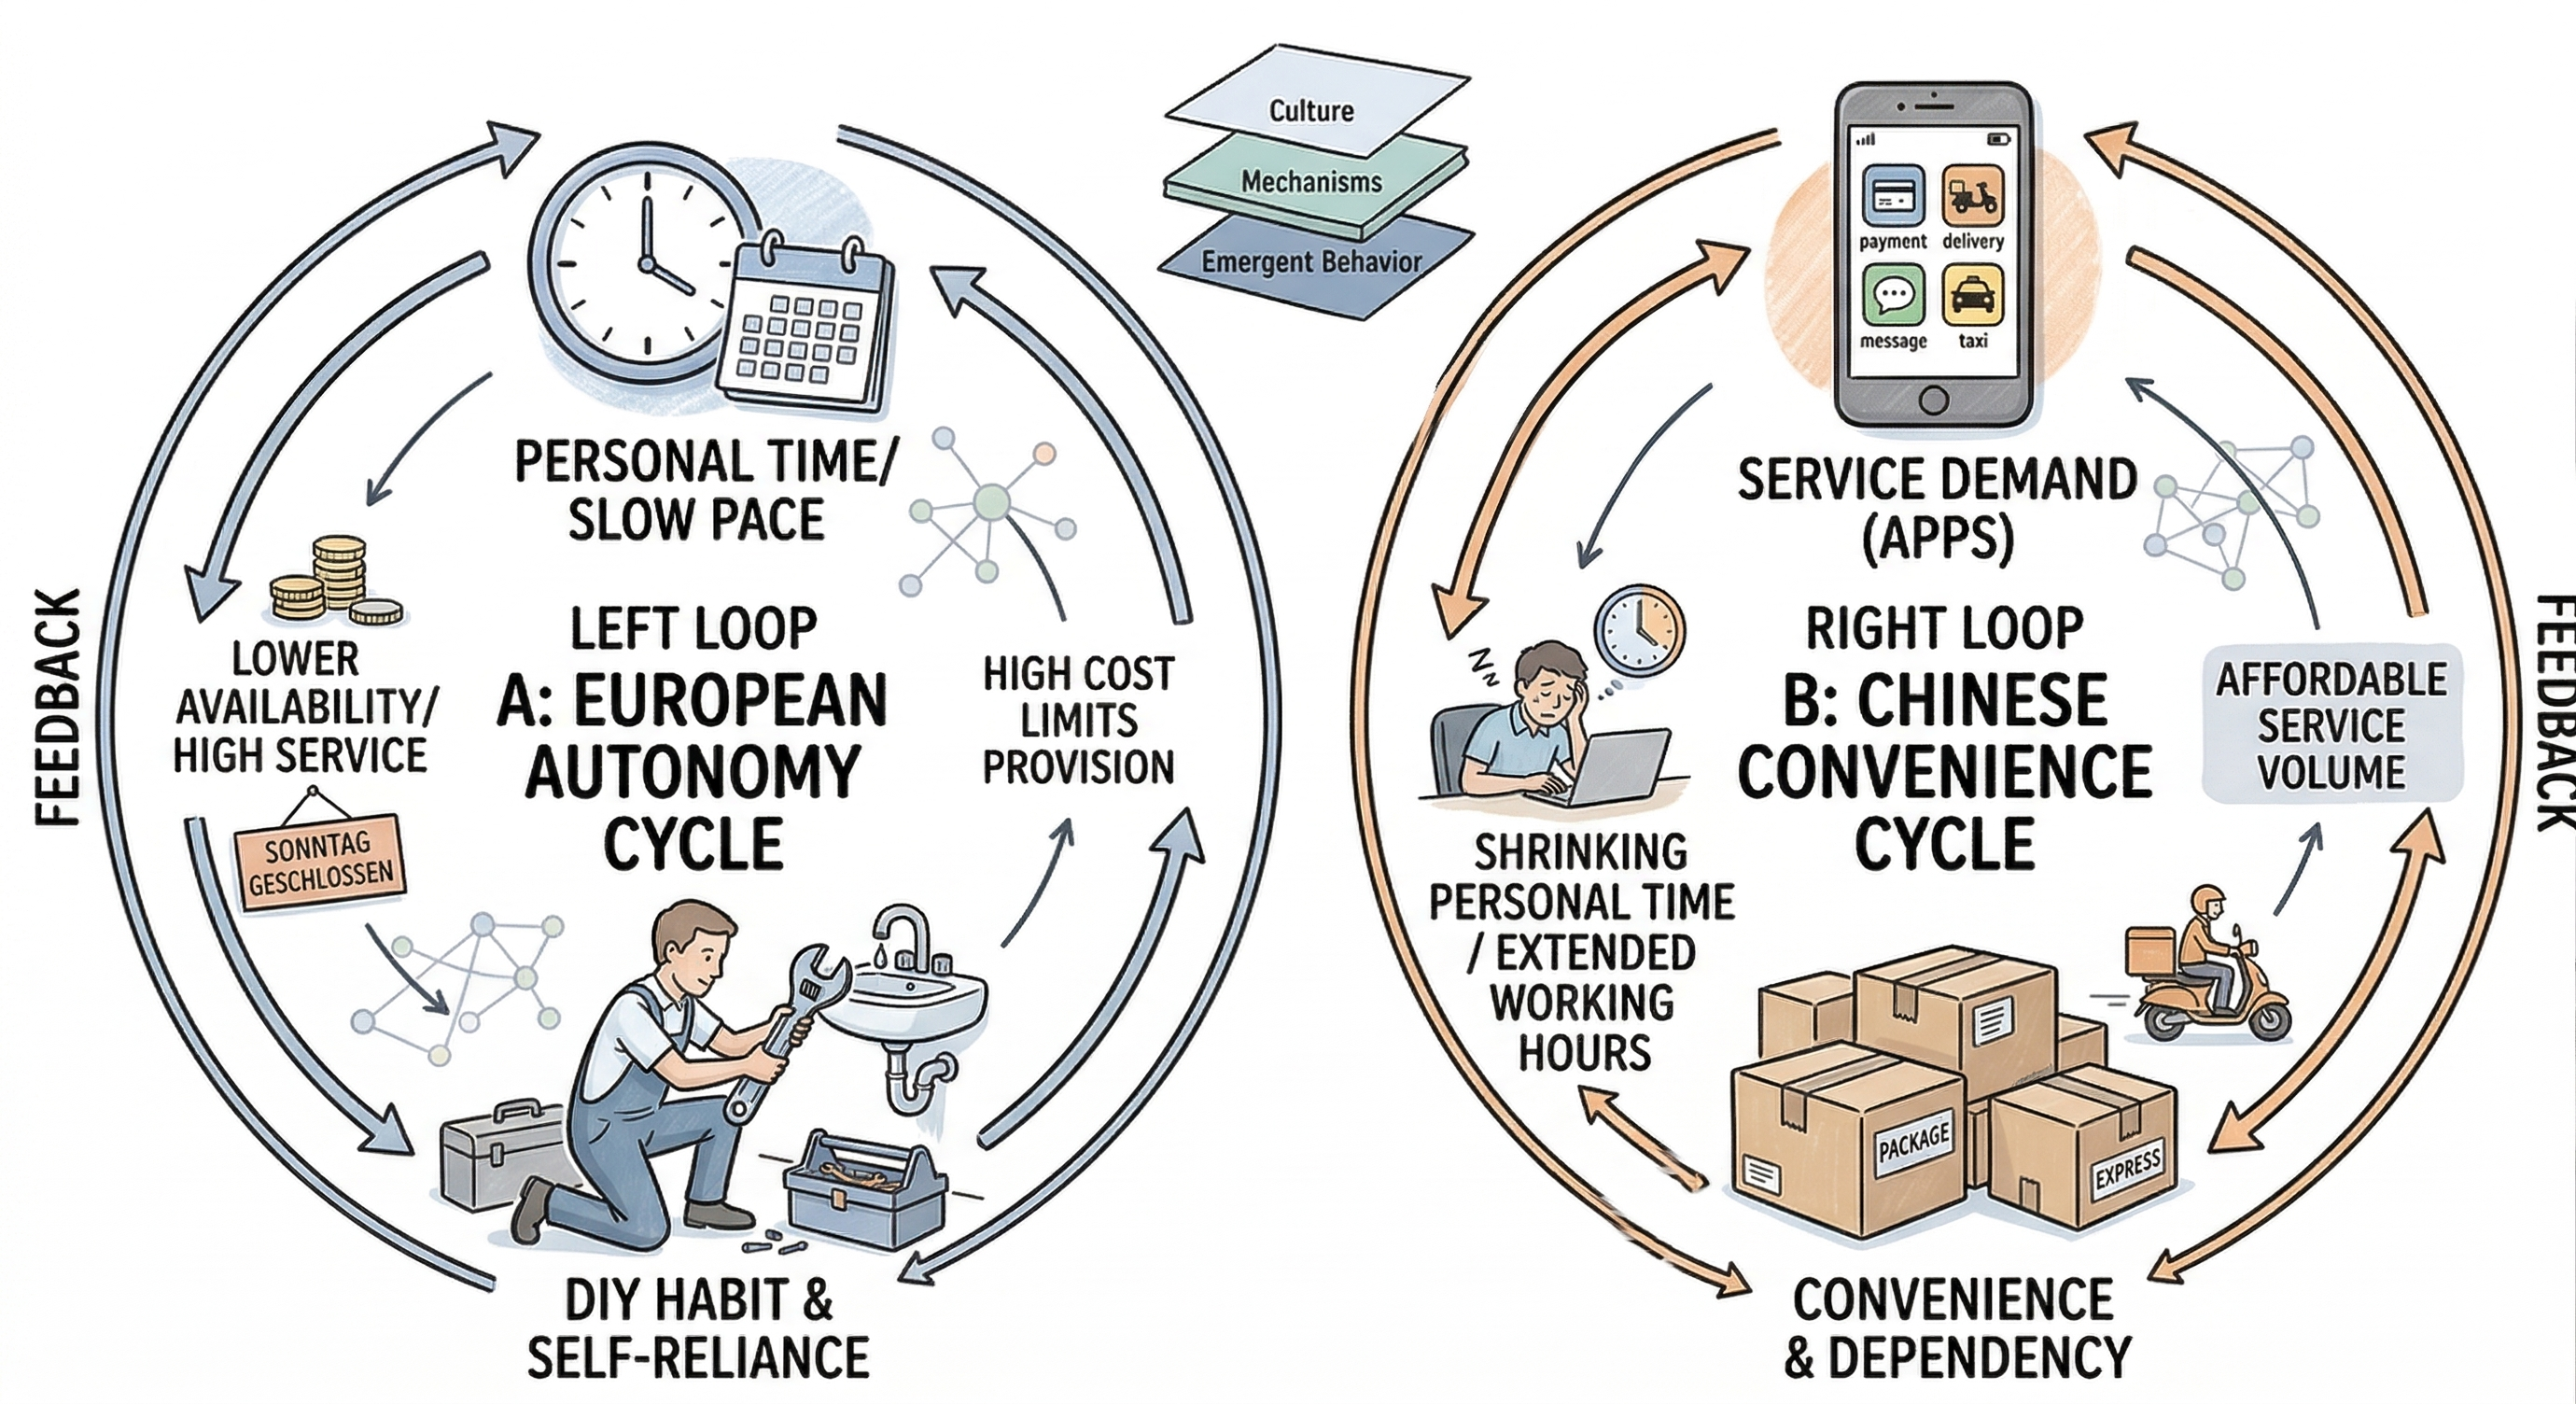
</p>

<p>That shift shaped the design of <a href="https://github.com/stevenbush/convenience-paradox"><em>The Convenience Paradox</em>, my small personal test project on GitHub</a>. Rather than treating the interface as a finished product, I approached it as a useful prototype: an attempt to build a research-facing layer on top of the simulation for configuring experiments, running them interactively, comparing runs, annotating results, and interrogating the model with LLM assistance without giving up the white-box logic of the ABM core. What emerged is a four-page Dash application that, while still exploratory in spirit, points toward one idea I want to keep developing: <strong>a good interface should not hide complexity. It should help researchers navigate it.</strong></p>

<blockquote>
  <p><strong>Core claim:</strong> In this project, the interface is not just a presentation layer. It is part of the research instrument.</p>
</blockquote>

<h2 id="architecture-the-interface-as-research-infrastructure">Architecture: The Interface as Research Infrastructure</h2>

<p>This interface is a small multi-page Plotly Dash prototype with four pages: <strong>Simulation Dashboard</strong>, <strong>LLM Studio</strong>, <strong>Run Manager</strong>, and <strong>Analysis</strong>. The design is easiest to understand as two layers.</p>

<p>The first is the <strong>visible application layer</strong>: Dash provides the shell, navigation, and interaction model; Plotly provides the charts; SQLite preserves runs for later comparison. This is the part the user touches directly.</p>

<p>The second is the <strong>shared control layer</strong> behind it: server-side state keeps the current simulation alive, small browser stores coordinate page interactions, and Python callbacks connect the interface directly to the Mesa model and the LLM service. That keeps the whole system in one coherent workflow instead of splitting it into disconnected tools.</p>

<p>
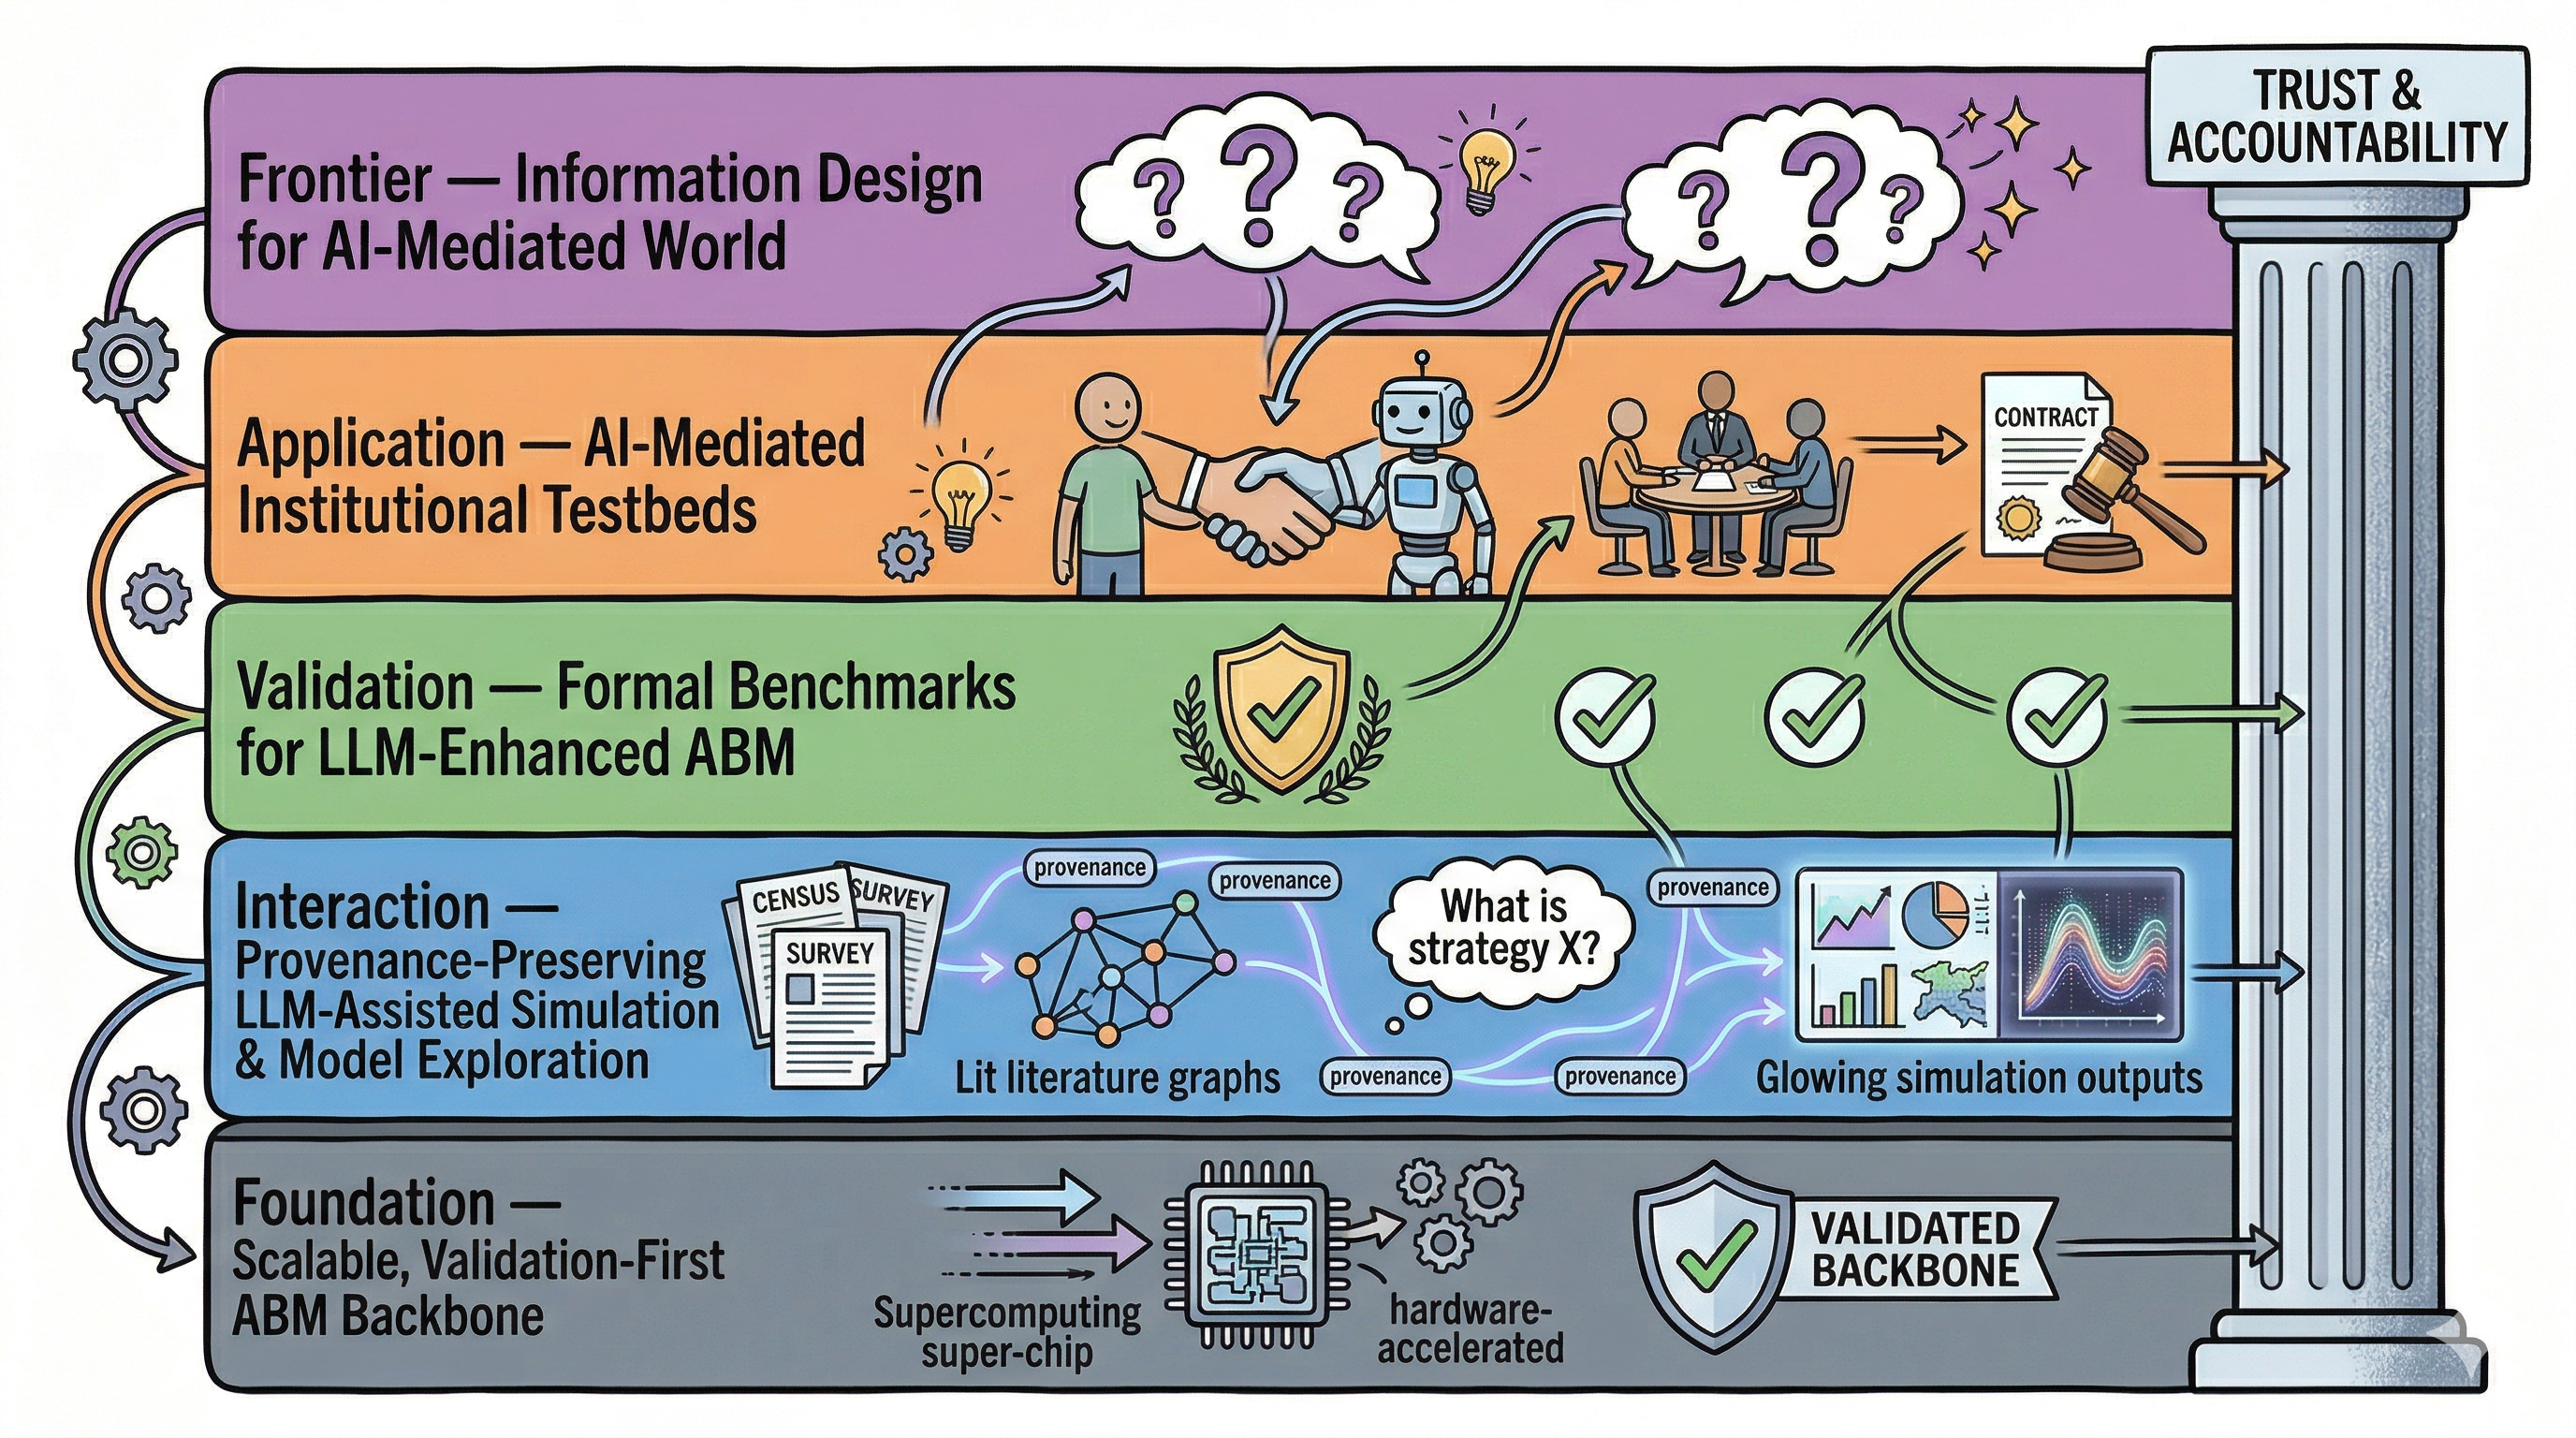
The architecture diagram below shows that structure in concrete terms: interface on top, control and state in the middle, and simulation, LLM, and persistence services underneath.</p>

<figure style="margin:1.75rem auto 1.4rem auto; width:100%; max-width:1040px;"><div style="background:#ffffff; border:1px solid #e5e7eb; border-radius:14px; padding:18px 18px 14px 18px; box-shadow:0 1px 2px rgba(15,23,42,0.06);"><img src="/Social-Complexity-Insights/assets/images/blog-social-systems-04-building-interface-for-simulated-societies/architecture-overview.svg" alt="Architecture overview of The Convenience Paradox interface, showing the Dash presentation layer, Python callback control plane, and the ABM, LLM, and data services underneath." width="1040" loading="lazy" style="display:block; width:100%; max-width:1040px; height:auto; margin:0 auto;" /></div><figcaption style="margin-top:0.9rem; font-size:0.98rem; line-height:1.6; color:#475569; text-align:center;"><strong style="color:#0f172a;">Figure — The Interface in Layers.</strong> It shows how the Dash pages, the control/state layer, the Mesa simulation, the LLM service, and SQLite persistence fit together.</figcaption></figure>

<p>
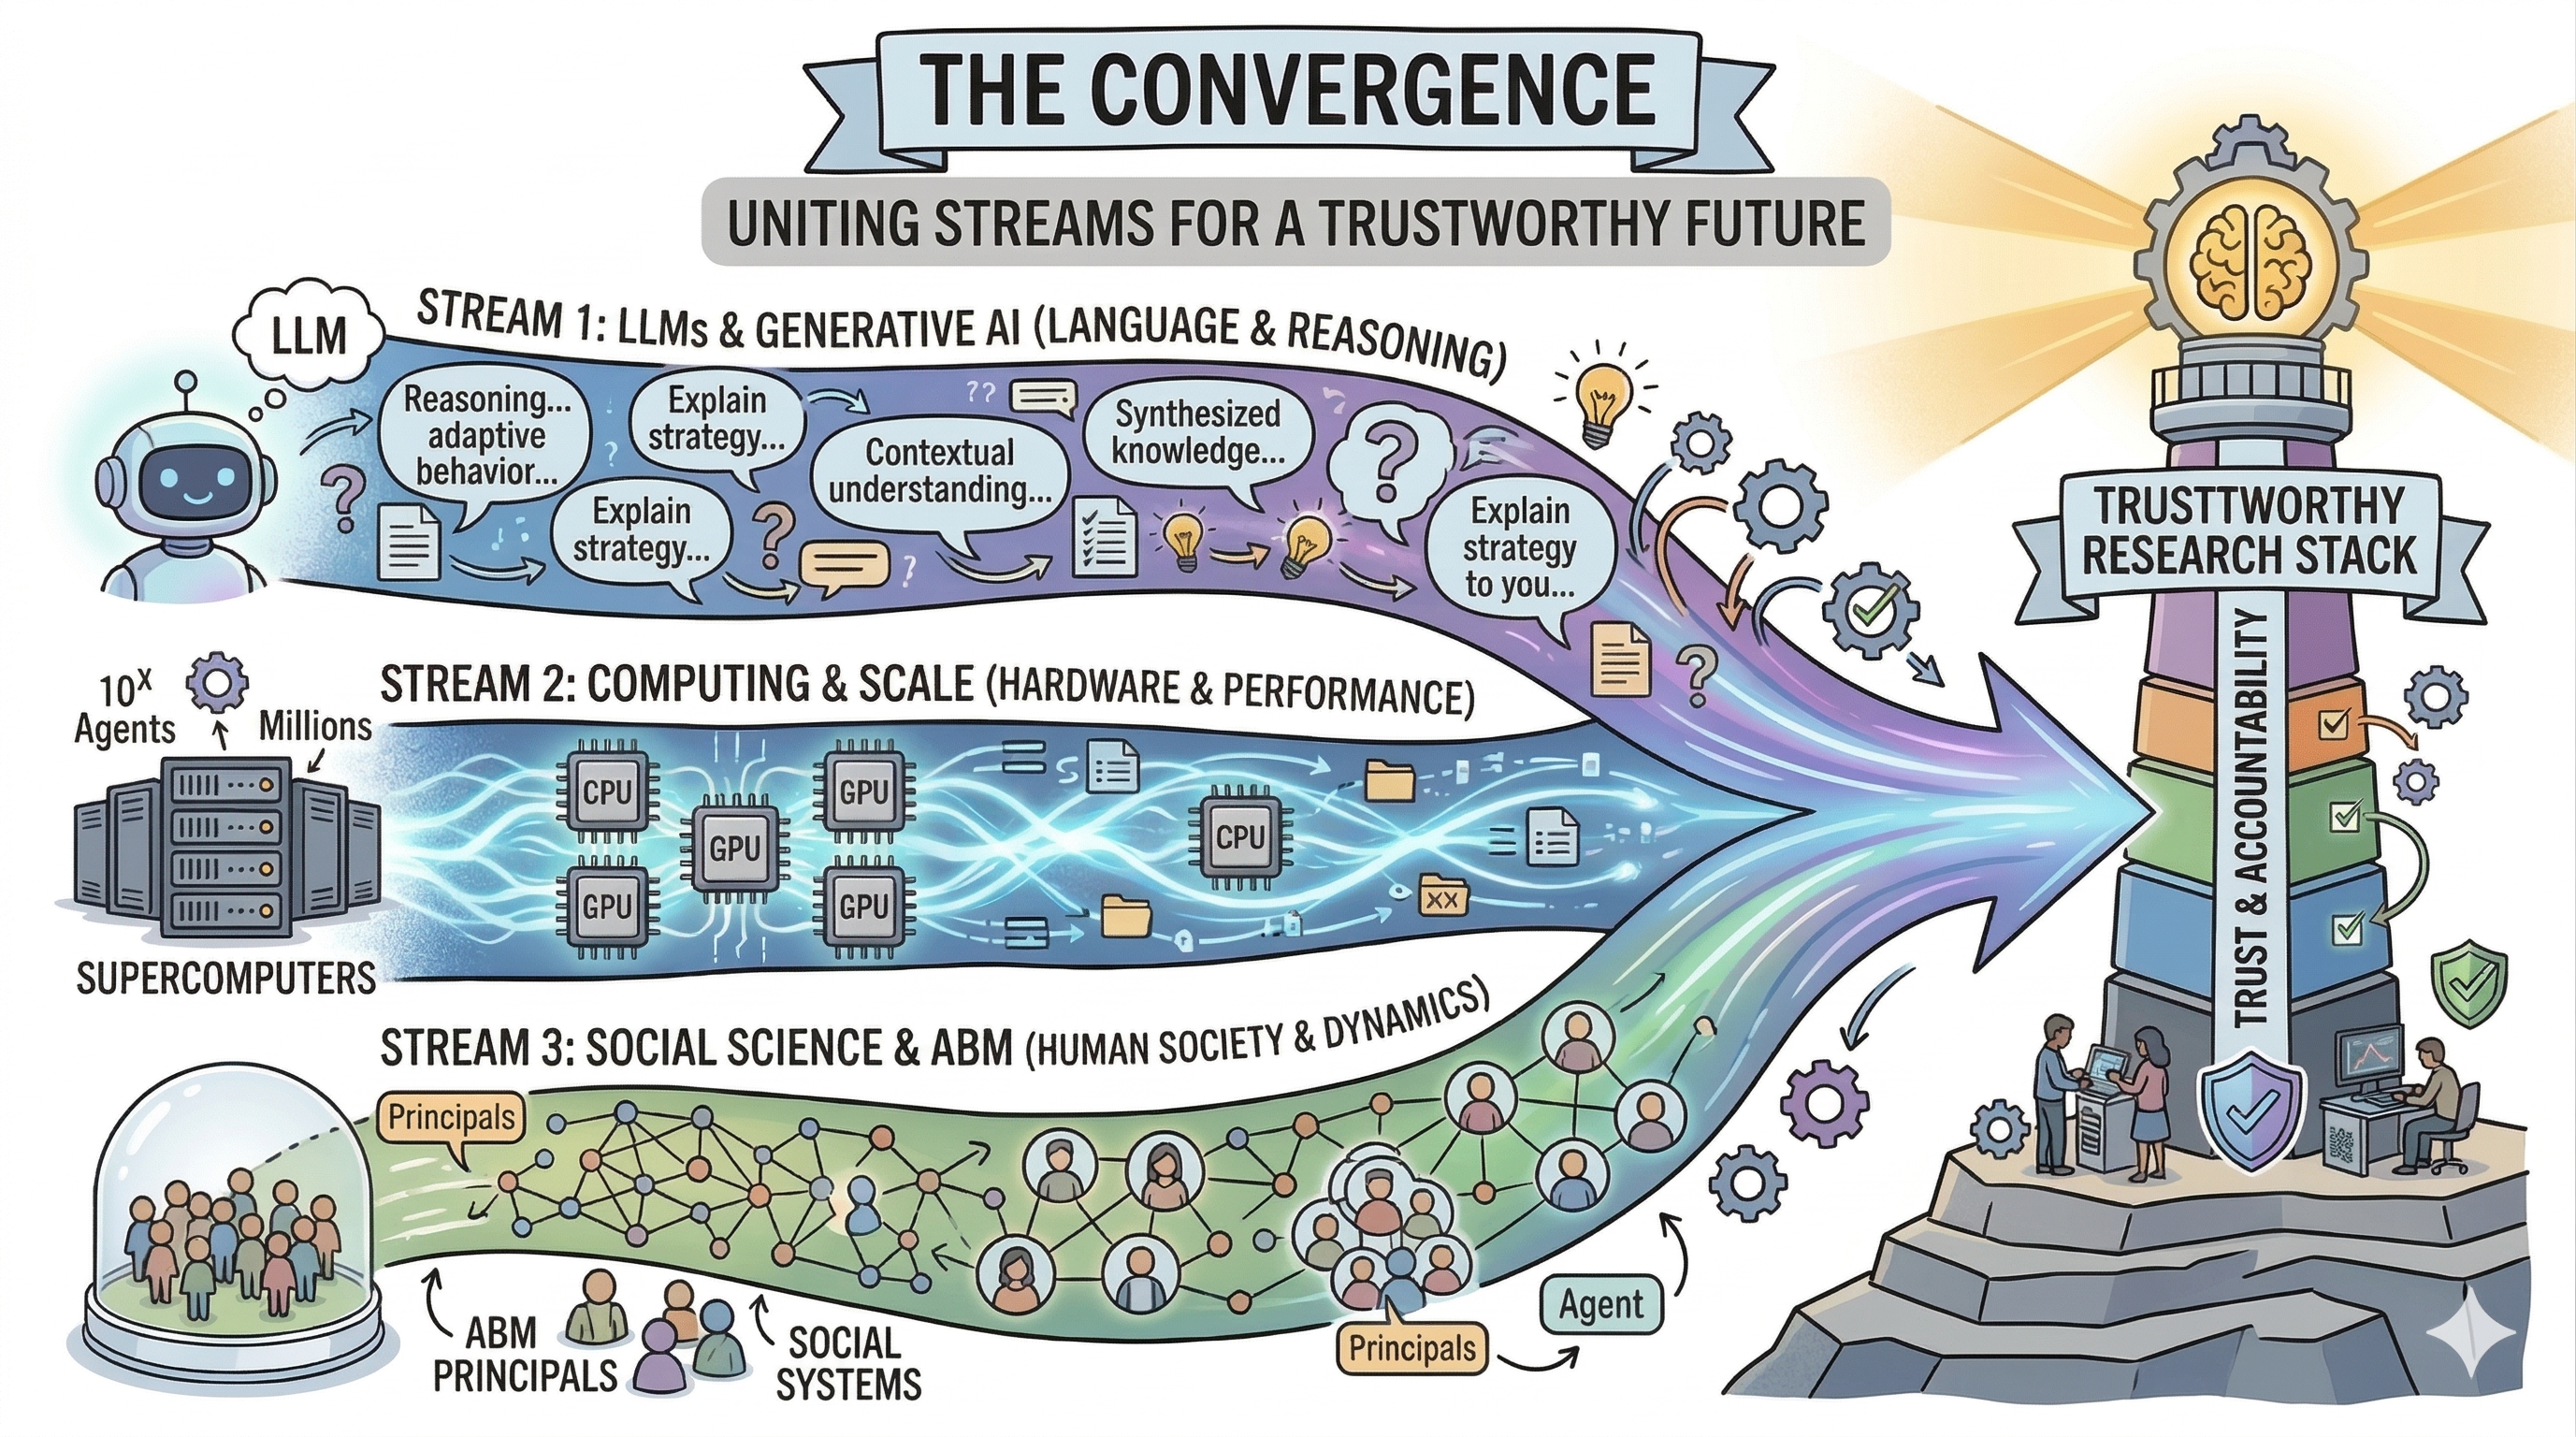
The concrete diagram maps directly onto the implementation. The abstract sketch below complements it by showing the same system at the level of design logic: model at the core, interface around it, and provenance connecting the layers.</p>

<figure style="margin:1.85rem auto 1.7rem auto; width:100%; max-width:960px;"><div style="background:#ffffff; border:1px solid #e5e7eb; border-radius:14px; padding:18px 18px 14px 18px; box-shadow:0 1px 2px rgba(15,23,42,0.06);"><img src="/Social-Complexity-Insights/assets/images/blog-social-systems-04-building-interface-for-simulated-societies/Illustration-1.png" alt="Sketchnote-style layered research interface stack showing the Mesa ABM engine, server-side state, Dash pages, schema and audit layer, and LLM Studio connected by a provenance column." width="960" loading="lazy" style="display:block; width:100%; max-width:960px; height:auto; margin:0 auto;" /></div><figcaption style="margin-top:0.9rem; font-size:0.98rem; line-height:1.6; color:#475569; text-align:center;"><strong style="color:#0f172a;">Illustration 1 — From Model to Interface.</strong> A layered view of the interface: simulation engine at the core, Dash shell above it, and schemas plus audit linking the LLM layer to the rest of the system.</figcaption></figure>

<p>What makes the architecture distinctive is <strong>LLM Studio</strong>. Instead of adding one generic chatbot, the interface separates five roles: scenario design, profile generation, result interpretation, chart annotation, and bounded forum experiments. This makes the LLM layer feel less like a gimmick and more like a set of research tools with different jobs.</p>

<p>Just as importantly, those roles do not all sit in the same place. Most stay at the model’s edges: they help configure, explain, or annotate. <strong>Only the forum mode enters the simulation loop</strong>, and even there the interface makes the boundary explicit through experimental labeling, short exchanges, capped updates, and auditability. That is the core architectural idea: the LLM is used as an interface layer around a transparent model, not as a hidden substitute for it.</p>

<blockquote>
  <p><strong>Architectural boundary:</strong> The LLM sits around a white-box model by default. Only forum mode enters the loop, and even there the intervention stays explicit, bounded, and auditable.</p>
</blockquote>

<h2 id="feature-showcase-a-quick-tour-of-the-interface">Feature Showcase: A Quick Tour of the Interface</h2>

<p>Before diving into the LLM layer, it helps to see the rest of the workbench in motion.</p>

<h3 id="simulation-dashboard">Simulation Dashboard</h3>

<p>The landing page is the operational center of the simulation. It combines parameter controls, preset switching, run actions, KPI cards, and a broad set of Plotly views: labor hours, stress and delegation, market health, provider-consumer stratification, task flows, and network topology. The goal is not just to show a few pretty charts. It is to let a researcher adjust assumptions and immediately see how the system responds.</p>

<figure style="margin:1.75rem auto 1.4rem auto; width:100%; max-width:1040px;"><div style="background:#ffffff; border:1px solid #e5e7eb; border-radius:14px; padding:18px 18px 14px 18px; box-shadow:0 1px 2px rgba(15,23,42,0.06);"><img src="/Social-Complexity-Insights/assets/images/blog-social-systems-04-building-interface-for-simulated-societies/simulation-dashboard.gif" alt="Animated walkthrough of the Simulation Dashboard showing parameter controls, live KPI cards, and multiple synchronized charts updating during a run." width="1040" loading="lazy" style="display:block; width:100%; max-width:1040px; height:auto; margin:0 auto;" /></div><figcaption style="margin-top:0.9rem; font-size:0.98rem; line-height:1.6; color:#475569; text-align:center;"><strong style="color:#0f172a;">Simulation Dashboard — The Operational Center.</strong> The Simulation Dashboard in action: parameter controls on the left, live KPIs on top, and multiple synchronized visual views updating as the run advances.</figcaption></figure>

<h3 id="run-manager">Run Manager</h3>

<p>Once runs accumulate, the question shifts from “what is happening now?” to “how do these experiments compare?” The Run Manager answers that with a SQLite-backed history table, filtering controls, editable labels, and one-metric comparison overlays. It turns simulation output into something closer to a lightweight experiment database.</p>

<figure style="margin:1.75rem auto 1.4rem auto; width:100%; max-width:1040px;"><div style="background:#ffffff; border:1px solid #e5e7eb; border-radius:14px; padding:18px 18px 14px 18px; box-shadow:0 1px 2px rgba(15,23,42,0.06);"><img src="/Social-Complexity-Insights/assets/images/blog-social-systems-04-building-interface-for-simulated-societies/run-manager.gif" alt="Animated walkthrough of the Run Manager showing saved simulation history, filtering controls, editable labels, and metric comparison overlays." width="1040" loading="lazy" style="display:block; width:100%; max-width:1040px; height:auto; margin:0 auto;" /></div><figcaption style="margin-top:0.9rem; font-size:0.98rem; line-height:1.6; color:#475569; text-align:center;"><strong style="color:#0f172a;">Run Manager — From Runs to Records.</strong> Run history, filtering, and metric comparison in the Run Manager, turning saved simulations into something inspectable rather than disposable.</figcaption></figure>

<h3 id="analysis">Analysis</h3>

<p>The Analysis page packages results for communication. It combines hypothesis cards, a preset-to-preset comparison workflow, and an interactive sensitivity heatmap. This is where the interface shifts from “running a model” to “presenting findings from a model” without leaving the application.</p>

<figure style="margin:1.75rem auto 1.4rem auto; width:100%; max-width:1040px;"><div style="background:#ffffff; border:1px solid #e5e7eb; border-radius:14px; padding:18px 18px 14px 18px; box-shadow:0 1px 2px rgba(15,23,42,0.06);"><img src="/Social-Complexity-Insights/assets/images/blog-social-systems-04-building-interface-for-simulated-societies/analysis.gif" alt="Animated walkthrough of the Analysis page showing hypothesis cards, preset comparison views, and an interactive sensitivity heatmap." width="1040" loading="lazy" style="display:block; width:100%; max-width:1040px; height:auto; margin:0 auto;" /></div><figcaption style="margin-top:0.9rem; font-size:0.98rem; line-height:1.6; color:#475569; text-align:center;"><strong style="color:#0f172a;">Analysis — From Results to Findings.</strong> The Analysis page presents research-facing views: hypothesis status, preset comparison, and an on-demand sensitivity heatmap.</figcaption></figure>

<h3 id="llm-studio-briefly">LLM Studio, Briefly</h3>

<p>One page, however, changes the character of the whole system. <strong>LLM Studio</strong> is where the interface stops being only a dashboard and becomes a research assistant layer. It brings together scenario parsing, profile generation, result interpretation, chart annotation, experimental agent forums, per-role model selection, and a session-level audit log in one workspace. I am only naming it here, not unpacking it yet, because it deserves more than a passing mention.</p>

<p>The most distinctive page in the application is the one I have barely explained so far. The charts make the model visible. LLM Studio makes the interaction logic visible. That is where the design philosophy of the project becomes easiest to see, and it is the part of the interface I want to look at most closely.</p>

<blockquote>
  <p><strong>Reading guide:</strong> The first three pages make the model runnable, comparable, and communicable. <strong>LLM Studio</strong> is where the interface becomes methodologically distinctive.</p>
</blockquote>

<h2 id="llm-studio-deep-dive">LLM Studio Deep Dive</h2>

<p>If the rest of the application is about running and reading simulations, LLM Studio is about shaping the conversation between researcher and model. The page is organized as a unified workspace with role-specific tabs, a model configuration panel, staged request stores, and a session-level audit log. The interface keeps each role distinct because each role solves a different research problem and requires a different level of control.</p>

<figure style="margin:1.85rem auto 1.7rem auto; width:100%; max-width:960px;"><div style="background:#ffffff; border:1px solid #e5e7eb; border-radius:14px; padding:18px 18px 14px 18px; box-shadow:0 1px 2px rgba(15,23,42,0.06);"><img src="/Social-Complexity-Insights/assets/images/blog-social-systems-04-building-interface-for-simulated-societies/Illustration-2.png" alt="Sketchnote-style white-box boundary diagram showing four LLM roles staying at the model edge while a fifth enters through a small bounded norm-update valve." width="960" loading="lazy" style="display:block; width:100%; max-width:960px; height:auto; margin:0 auto;" /></div><figcaption style="margin-top:0.9rem; font-size:0.98rem; line-height:1.6; color:#475569; text-align:center;"><strong style="color:#0f172a;">Illustration 2 — The Bounded LLM Boundary.</strong> LLM Roles 1 to 4 stay at the interface edges; LLM Role 5 enters the simulation only through a narrow, bounded valve.</figcaption></figure>

<figure style="margin:1.85rem auto 1.7rem auto; width:100%; max-width:960px;"><div style="background:#ffffff; border:1px solid #e5e7eb; border-radius:14px; padding:18px 18px 14px 18px; box-shadow:0 1px 2px rgba(15,23,42,0.06);"><img src="/Social-Complexity-Insights/assets/images/blog-social-systems-04-building-interface-for-simulated-societies/Illustration-3.png" alt="Sketchnote-style workflow showing five LLM roles mapped to five stages of the research process around a central ABM dashboard." width="960" loading="lazy" style="display:block; width:100%; max-width:960px; height:auto; margin:0 auto;" /></div><figcaption style="margin-top:0.9rem; font-size:0.98rem; line-height:1.6; color:#475569; text-align:center;"><strong style="color:#0f172a;">Illustration 3 — Five Roles, One Workbench.</strong> The five roles are not five chat tricks; they map onto five different points in the research workflow.</figcaption></figure>

<h3 id="role-1--scenario-parser">Role 1 — Scenario Parser</h3>

<p>The first problem it solves is simple but important: researchers usually think in social descriptions before they think in parameter names. Role 1 gives them a place to start from natural language. In the interface, the user describes a society in plain English, the page stages a request, and the right-hand inspector returns structured values mapped onto a subset of <code class="language-plaintext highlighter-rouge">SimulationParams</code>. The output is not auto-applied in secret. The user reviews it and then decides whether to push those values into the Simulation Dashboard.</p>

<p>On the backend, <code class="language-plaintext highlighter-rouge">api/llm_service.py</code> calls the model with a constrained schema, and <code class="language-plaintext highlighter-rouge">api/schemas.py</code> defines the exact fields the model may fill. Missing values are allowed, which is a feature rather than a weakness. It means the system can admit uncertainty and fall back to neutral defaults instead of inventing precision.</p>

<p>The design principle here is that the LLM is translating <em>research language into parameter language</em>, not deciding the experiment for the user.</p>

<figure style="margin:1.75rem auto 1.4rem auto; width:100%; max-width:1040px;"><div style="background:#ffffff; border:1px solid #e5e7eb; border-radius:14px; padding:18px 18px 14px 18px; box-shadow:0 1px 2px rgba(15,23,42,0.06);"><img src="/Social-Complexity-Insights/assets/images/blog-social-systems-04-building-interface-for-simulated-societies/llm-studio-role-1.gif" alt="Animated walkthrough of LLM Studio Role 1 converting a free-text social scenario into structured simulation parameters with an explicit review step." width="1040" loading="lazy" style="display:block; width:100%; max-width:1040px; height:auto; margin:0 auto;" /></div><figcaption style="margin-top:0.9rem; font-size:0.98rem; line-height:1.6; color:#475569; text-align:center;"><strong style="color:#0f172a;">Role 1 — From Scenario to Parameters.</strong> Role 1 turns a free-text social description into structured simulation parameters, with an explicit review step before anything reaches the dashboard.</figcaption></figure>

<h3 id="role-2--profile-generator">Role 2 — Profile Generator</h3>

<p>Role 2 tackles a different bottleneck: agent heterogeneity is easier to talk about in social terms than in numeric vectors. The interface lets a user describe one agent archetype and then returns a structured profile with delegation preference and four skill dimensions. The output is immediately legible as simulation input rather than generic prose.</p>

<p>What matters in implementation terms is that the interface does not pretend the LLM is “being the agent.” It is generating inspectable attributes that can later be used to seed a model population. That distinction keeps the behavioral logic where it belongs: inside the <code class="language-plaintext highlighter-rouge">Resident</code> rules, not inside opaque dialogue.</p>

<p>The design principle is that LLMs are useful for <strong>constructing explicit heterogeneity</strong>, but the simulation should still run on visible rules.</p>

<figure style="margin:1.75rem auto 1.4rem auto; width:100%; max-width:1040px;"><div style="background:#ffffff; border:1px solid #e5e7eb; border-radius:14px; padding:18px 18px 14px 18px; box-shadow:0 1px 2px rgba(15,23,42,0.06);"><img src="/Social-Complexity-Insights/assets/images/blog-social-systems-04-building-interface-for-simulated-societies/llm-studio-role-2.gif" alt="Animated walkthrough of LLM Studio Role 2 converting a textual persona into simulation-ready attributes for agent heterogeneity." width="1040" loading="lazy" style="display:block; width:100%; max-width:1040px; height:auto; margin:0 auto;" /></div><figcaption style="margin-top:0.9rem; font-size:0.98rem; line-height:1.6; color:#475569; text-align:center;"><strong style="color:#0f172a;">Role 2 — Defining Heterogeneity.</strong> Role 2 converts a textual persona into simulation-ready attributes, making heterogeneity easier to define without turning the agent into a black box.</figcaption></figure>

<h3 id="role-3--result-interpreter">Role 3 — Result Interpreter</h3>

<p>Role 3 is the most obviously conversational tab, but it is not a free-form chatbot. The user asks about the current run, and the interface bundles the question together with a compact simulation snapshot: recent metrics, current step, selected parameters, and conversation history. The returned answer is structured into a concise response, a fuller explanation, a hypothesis connection, and a confidence note.</p>

<p>That shape matters. It forces the interpretation layer to stay tied to the current experiment and to acknowledge methodological limits when needed. In other words, the role is not rewarded for sounding clever. It is rewarded for reconnecting visible metrics to explicit hypotheses and for stating caveats when a conclusion is still unstable.</p>

<p>The design principle is <strong>mechanism-oriented interpretation</strong>: use language to make results more legible, not to smuggle in a new causal theory.</p>

<figure style="margin:1.75rem auto 1.4rem auto; width:100%; max-width:1040px;"><div style="background:#ffffff; border:1px solid #e5e7eb; border-radius:14px; padding:18px 18px 14px 18px; box-shadow:0 1px 2px rgba(15,23,42,0.06);"><img src="/Social-Complexity-Insights/assets/images/blog-social-systems-04-building-interface-for-simulated-societies/llm-studio-role-3.gif" alt="Animated walkthrough of LLM Studio Role 3 interpreting the current simulation snapshot with linked metrics, hypotheses, and caveats." width="1040" loading="lazy" style="display:block; width:100%; max-width:1040px; height:auto; margin:0 auto;" /></div><figcaption style="margin-top:0.9rem; font-size:0.98rem; line-height:1.6; color:#475569; text-align:center;"><strong style="color:#0f172a;">Role 3 — Interpreting a Run.</strong> Role 3 interprets the current simulation snapshot in context, connecting visible metrics to hypotheses and caveats rather than improvising detached commentary.</figcaption></figure>

<h3 id="role-4--visualization-annotator">Role 4 — Visualization Annotator</h3>

<p>This role exists because charts rarely explain themselves. A line can rise, flatten, or split for many reasons, and a research interface should help a reader reconnect the picture to the underlying mechanism. In the UI, the user can annotate all charts at once and watch cards fill in chart by chart.</p>

<p>What happens behind the scenes is the key design move: the program first computes summary facts from the chart data, and only then asks the LLM for a caption and one key insight. That ordering is crucial. The LLM is not deciding what the data says. The code computes the facts; the LLM translates them into clearer language.</p>

<p>The design principle is <strong>facts first, language second</strong>. That sounds modest, but it is exactly the kind of boundary that makes LLM integration usable in research settings.</p>

<figure style="margin:1.75rem auto 1.4rem auto; width:100%; max-width:1040px;"><div style="background:#ffffff; border:1px solid #e5e7eb; border-radius:14px; padding:18px 18px 14px 18px; box-shadow:0 1px 2px rgba(15,23,42,0.06);"><img src="/Social-Complexity-Insights/assets/images/blog-social-systems-04-building-interface-for-simulated-societies/llm-studio-role-4.gif" alt="Animated walkthrough of LLM Studio Role 4 generating chart annotations from computed summaries rather than direct free-form interpretation." width="1040" loading="lazy" style="display:block; width:100%; max-width:1040px; height:auto; margin:0 auto;" /></div><figcaption style="margin-top:0.9rem; font-size:0.98rem; line-height:1.6; color:#475569; text-align:center;"><strong style="color:#0f172a;">Role 4 — Explaining the Charts.</strong> Role 4 annotates charts from computed summaries, so the interface asks the LLM to explain facts rather than invent them.</figcaption></figure>

<h3 id="role-5--agent-forums">Role 5 — Agent Forums</h3>

<p>Role 5 is where the project becomes methodologically ambitious. Standard simulation runs keep norm adaptation fully rule-based. The forum mode introduces a deliberately bounded gray-box experiment: a sample of agents joins short small-group discussions, the system extracts a norm signal from each discussion, and that signal can nudge delegation preference by a capped amount.</p>

<p>The interface makes the experimental status impossible to miss. The tab is labeled <strong>Experimental Mode</strong>. The user controls forum fraction, exact or derived participant count, group count, and dialogue turns. The result is not a hidden update to the model state. It is a visible transcript workspace with group status, dialogue turns, extracted summaries, confidence values, and preference updates.</p>

<p>The backend logic in <code class="language-plaintext highlighter-rouge">model/forums.py</code> is equally explicit. The dialogue is short. The extracted outcome is structured. The update uses <code class="language-plaintext highlighter-rouge">delta = norm_signal * confidence * NORM_UPDATE_CAP</code>. Full audit visibility is preserved. That is what allows the role to exist without undermining the rest of the model. The project is not claiming that the LLM now <em>is</em> the social mechanism. It is testing whether a carefully bounded language layer changes the dynamics in a measurable way.</p>

<p>The design principle is <strong>controlled gray-box experimentation</strong>: if an LLM enters the loop, its influence must be limited, labeled, and inspectable.</p>

<figure style="margin:1.75rem auto 1.4rem auto; width:100%; max-width:1040px;"><div style="background:#ffffff; border:1px solid #e5e7eb; border-radius:14px; padding:18px 18px 14px 18px; box-shadow:0 1px 2px rgba(15,23,42,0.06);"><img src="/Social-Complexity-Insights/assets/images/blog-social-systems-04-building-interface-for-simulated-societies/llm-studio-role-5.gif" alt="Animated walkthrough of LLM Studio Role 5 running a bounded forum experiment with visible transcripts, extracted norm signals, and capped preference updates." width="1040" loading="lazy" style="display:block; width:100%; max-width:1040px; height:auto; margin:0 auto;" /></div><figcaption style="margin-top:0.9rem; font-size:0.98rem; line-height:1.6; color:#475569; text-align:center;"><strong style="color:#0f172a;">Role 5 — A Bounded Forum Experiment.</strong> Role 5 runs a bounded forum experiment with explicit transcripts, extracted norm signals, and capped preference updates visible in the interface.</figcaption></figure>

<p>Across all five roles, one feature ties the page together: the audit log. Every role leaves behind a visible trace of model choice, timing, prompt payload, and result payload. That is not just a debugging convenience. It is the interface embodiment of a broader methodological stance: <strong>if LLMs are going to participate in the research workflow, their participation should be reviewable.</strong></p>

<blockquote>
  <p><strong>Methodological rule:</strong> If an LLM participates in the workflow, its contribution should leave a visible trace.</p>
</blockquote>

<figure style="margin:1.85rem auto 1.7rem auto; width:100%; max-width:960px;"><div style="background:#ffffff; border:1px solid #e5e7eb; border-radius:14px; padding:18px 18px 14px 18px; box-shadow:0 1px 2px rgba(15,23,42,0.06);"><img src="/Social-Complexity-Insights/assets/images/blog-social-systems-04-building-interface-for-simulated-societies/Illustration-4.png" alt="Sketchnote-style audit trail diagram linking prompt, schema, LLM output, UI result, and research conclusion into one provenance chain." width="960" loading="lazy" style="display:block; width:100%; max-width:960px; height:auto; margin:0 auto;" /></div><figcaption style="margin-top:0.9rem; font-size:0.98rem; line-height:1.6; color:#475569; text-align:center;"><strong style="color:#0f172a;">Illustration 4 — The Audit Chain.</strong> Prompts, schemas, outputs, and UI actions are linked into a provenance chain rather than disappearing behind the interface.</figcaption></figure>

<h2 id="closing">Closing</h2>

<p>What I wanted from this project was not just a nicer way to look at simulation output. I wanted an interface that could operate as part of the research method itself: configure scenarios, expose model behavior, manage runs, present findings, and integrate LLM assistance without surrendering the white-box clarity of the underlying ABM.</p>

<p>That is why I think of this application less as a dashboard and more as a small piece of research infrastructure. The simulation engine, GUI layer, visual analytics, LLM roles, and audit mechanisms are doing different jobs, but they are organized around one common task: helping a researcher move from question to experiment to explanation without losing sight of the assumptions in between.</p>

<p>If there is one lesson I take from building it, it is that <strong>interface design is not secondary to computational modeling</strong>. In projects like this, the interface is where transparency either survives or disappears. A good research interface does not simply make complex systems look better. It makes them easier to question. And in that sense, it is still doing what I care about most: making the invisible visible.</p>

<blockquote>
  <p><strong>Bottom line:</strong> In this kind of project, interface design is part of the method. It is where transparency either survives or disappears.</p>
</blockquote>

<p><em>This project explores abstract social dynamics and is not intended to characterize or evaluate any specific society, culture, or nation.</em></p>]]></content><author><name>Jiyuan Shi</name></author><summary type="html"><![CDATA[Opening Hook]]></summary></entry><entry><title type="html">What a Toy World Taught Me About Convenience</title><link href="https://stevenbush.github.io/Social-Complexity-Insights/2026/04/03/what-a-toy-world-taught-me-about-convenience/" rel="alternate" type="text/html" title="What a Toy World Taught Me About Convenience" /><published>2026-04-03T00:00:00+08:00</published><updated>2026-04-03T00:00:00+08:00</updated><id>https://stevenbush.github.io/Social-Complexity-Insights/2026/04/03/what-a-toy-world-taught-me-about-convenience</id><content type="html" xml:base="https://stevenbush.github.io/Social-Complexity-Insights/2026/04/03/what-a-toy-world-taught-me-about-convenience/"><![CDATA[<h2 id="pulling-the-thread">Pulling the Thread</h2>

<blockquote>
  <p><strong>Takeaway:</strong> This post begins from a causal question prose alone could not resolve, then turns to a toy model not for grand prediction, but for sharper structural reasoning.</p>
</blockquote>

<p>In my <a href="/Social-Complexity-Insights/2026/03/29/convenience-autonomy-and-hidden-architectures/">previous post</a>, I stood in front of a closed supermarket on a Sunday afternoon and started pulling a thread. That small friction — a locked door, a fifteen-minute drive to the next shop — unraveled into something much larger: a web of feedback loops connecting convenience, autonomy, service pricing, and social norms into two distinct architectures of everyday life.</p>

<p>I described two rhythms. One where individuals handle most tasks personally, tolerate slower timelines, and pay higher prices for the services they do use. Another where delegation is the default, services are cheap and abundant, and the entire infrastructure assumes you will outsource rather than self-serve. These are not random cultural differences, I argued. They are emergent properties of interconnected social mechanisms, each reinforcing the other.</p>

<blockquote>
  <p><em>The question I could not answer was simple to state and hard to untangle:</em> <strong>which came first — the cheap service or the dependency on it?</strong></p>
</blockquote>

<p>That question haunted me. It was too tangled for prose alone — too many interacting parts, too many feedback loops running in parallel, too many plausible stories that all sounded equally convincing. So I did what a systems engineer does when a problem resists verbal reasoning: I built a model.</p>

<p>Not a grand model. A toy. One hundred simulated agents, each given eight hours of discretionary time per day, a handful of tasks, and a single decision to make for each one: <em>do it myself, or hand it to someone else?</em> I ran this toy world 14,656 times under different configurations, sweeping across delegation preferences, task pressures, service costs, and conformity levels. What emerged surprised me — not because the model answered my questions, but because of <em>how</em> it sharpened them.</p>

<p>This post is the story of what I found. <strong>Every number reported here comes from actual simulation runs. Every chart was generated from real data. And every limitation is stated honestly</strong> — because a toy model that knows its edges is more useful than a grand theory that pretends it has none.</p>

<p>This essay is a blog-oriented adaptation of the underlying formal research report for the project. Readers who want the more technical source document can find it here: <a href="https://github.com/stevenbush/convenience-paradox/blob/main/formal_research_report.md">formal research report</a>.</p>

<!-- ILLUSTRATION 1: "Two Rhythms"
Caption: "Two neighborhoods, two rhythms. The friction is not a flaw — it is a trace of a different architecture."
Generation prompt: "Sketchnote illustration, hand-drawn style, warm earth tones (terracotta, sage green, soft navy on off-white). Split composition: left side shows a quiet neighborhood with a few people walking, a closed shop with a 'Sunday' sign, someone cooking at home. Right side shows a busy neighborhood, delivery riders, glowing convenience store signs at night, people on phones ordering. A thin dotted line separates the two sides. No country flags, no text labels except 'slower rhythm' and 'faster rhythm' in handwritten font. Clean, minimal, warm." -->

<figure style="margin:1.85rem auto 1.7rem auto; width:100%; max-width:960px;"><div style="background:#ffffff; border:1px solid #e5e7eb; border-radius:14px; padding:18px 18px 14px 18px; box-shadow:0 1px 2px rgba(15,23,42,0.06);"><img src="/Social-Complexity-Insights/assets/images/blog-social-systems-03-toy-world-convenience/illustration-1.png" alt="Sketchnote-style split scene showing two neighborhoods: a quieter self-reliant rhythm on the left and a busier convenience-oriented rhythm on the right." width="960" loading="lazy" style="display:block; width:100%; max-width:960px; height:auto; margin:0 auto;" /></div><figcaption style="margin-top:0.9rem; font-size:0.98rem; line-height:1.6; color:#475569; text-align:center;"><strong style="color:#0f172a;">Illustration 1 — Two Rhythms.</strong> Two neighborhoods, two rhythms. The friction is not a flaw — it is a trace of a different architecture.</figcaption></figure>

<hr />

<h2 id="rules-of-a-small-world">Rules of a Small World</h2>

<blockquote>
  <p><strong>Takeaway:</strong> The model is deliberately simple, but its simplifications are explicit: every agent has limited time, every delegated task still has to be done by someone, and overload accumulates rather than disappearing.</p>
</blockquote>

<p>A toy model is not a small model. It is a <em>transparent</em> one. Every rule is visible, every assumption stated. What it lacks in realism, it gains in honesty. You can take it apart, inspect every gear, and decide for yourself whether the simplifications matter. Here are the rules of this particular toy world.</p>

<p>One hundred agents live on a small-world network — a social graph where most connections are local (like a tight-knit neighborhood) but a few long-range links allow information and norms to diffuse across the entire society. Each morning, every agent wakes up with <strong>8.0 hours</strong> of discretionary time and receives a random stack of daily tasks — cooking, errands, paperwork, repairs — between one and five per day. For each task, the agent makes a single choice: do it myself, or delegate it to someone else.</p>

<p>That choice is not random. It integrates four pressures into a single delegation probability:</p>

<ul>
  <li><strong>Cultural disposition</strong> — an inherent tendency toward self-reliance or delegation, initialized from a distribution that differs between society types and evolving over time through social influence</li>
  <li><strong>Stress</strong> — when available time runs short, agents are more likely to delegate as a coping mechanism, adding 30% of their stress level to the delegation probability</li>
  <li><strong>Skill</strong> — agents skilled at a particular task type gain less from outsourcing it; high proficiency <em>reduces</em> the urge to delegate</li>
  <li><strong>Cost</strong> — expensive services discourage delegation; cheap ones remove the economic brake</li>
</ul>

<p>The agent combines these four forces, flips a weighted coin, and acts. Simple. Auditable. No hidden weights, no opaque neural networks, no black-box magic.</p>

<p>Here is the critical design choice that makes the paradox possible: <strong>every agent is both a potential delegator and a potential provider</strong>. There is no separate “worker class.” The same person who orders takeout might spend the next hour delivering someone else’s groceries. And crucially, unmatched tasks — those that no provider has time to fulfil — do not vanish. They carry over to the next day as backlog. This makes overload cumulative. Convenience that exceeds capacity does not gracefully degrade; it compounds.</p>

<p><strong>Figure 1 — The feedback loops driving the convenience paradox</strong></p>

<figure style="margin:1.75rem auto 1.4rem auto; width:100%; max-width:760px;"><div style="background:#ffffff; border:1px solid #e5e7eb; border-radius:14px; padding:18px 18px 14px 18px; box-shadow:0 1px 2px rgba(15,23,42,0.06);"><img src="/Social-Complexity-Insights/assets/images/blog-social-systems-03-toy-world-convenience/fig-causal-loop.svg" alt="Conceptual causal loop diagram showing two reinforcing loops: R1 (stress-driven delegation spiral) and R2 (norm-driven convenience lock-in), with nodes for delegation intensity, provider burden, available personal time, stress, backlog, norm reinforcement, and delegation convenience." width="760" loading="lazy" style="display:block; width:100%; max-width:760px; height:auto; margin:0 auto;" /></div></figure>

<p>Two reinforcing feedback loops drive the dynamics. <strong>R1</strong> (the stress spiral): stress pushes agents to delegate more, delegation creates provider burden, burden depletes available time, depleted time creates more stress — which triggers even more delegation. <strong>R2</strong> (the norm lock-in): as delegation becomes widespread, it reinforces social norms around convenience, those norms make delegation feel natural and expected, which encourages even more delegation. In a low-delegation society, these loops stay quiet. In a high-delegation society, they hum constantly.</p>

<p>I configured two society presets to test these loops. <strong>Type A (Autonomy-Oriented)</strong>: delegation preference mean 0.25, service cost factor 0.65, social conformity pressure 0.15, mean task load 2.2 per step. <strong>Type B (Convenience-Oriented)</strong>: delegation preference mean 0.72, service cost factor 0.20, conformity pressure 0.65, mean task load 2.8 per step. Same agents, same 8-hour days, same task types. What changes is the preset architecture around the day: how much work enters it, how agents respond to that work, and how strongly the surrounding norm pushes them toward delegation.</p>

<!-- ILLUSTRATION 2: "A Day in the Life of an Agent"
Caption: "Each agent wakes up with 8 hours and a stack of tasks. By nightfall, the question is: who actually did the work?"
Generation prompt: "Sketchnote illustration, hand-drawn style, warm earth tones (terracotta, sage green, soft navy on off-white). A simple flowchart showing an abstract person receiving a stack of cards (tasks). Arrows branch: one path labeled 'do it myself' leads to a clock ticking; another path labeled 'delegate' leads to a second person who also has their own stack. Small icons: a handshake (coordination cost), a speech bubble (matching), a returning arrow (backlog: tasks come back tomorrow). Clean, diagrammatic but warm, like a whiteboard sketch." -->

<figure style="margin:1.85rem auto 1.7rem auto; width:100%; max-width:960px;"><div style="background:#ffffff; border:1px solid #e5e7eb; border-radius:14px; padding:18px 18px 14px 18px; box-shadow:0 1px 2px rgba(15,23,42,0.06);"><img src="/Social-Complexity-Insights/assets/images/blog-social-systems-03-toy-world-convenience/illustration-2.png" alt="Sketchnote-style flow diagram of an agent waking with tasks and branching between doing tasks personally or delegating them, with matching and backlog loops." width="960" loading="lazy" style="display:block; width:100%; max-width:960px; height:auto; margin:0 auto;" /></div><figcaption style="margin-top:0.9rem; font-size:0.98rem; line-height:1.6; color:#475569; text-align:center;"><strong style="color:#0f172a;">Illustration 2 — A Day in the Life of an Agent.</strong> Each agent wakes up with 8 hours and a stack of tasks. By nightfall, the question is: who actually did the work?</figcaption></figure>

<p>This is not a crystal ball. It is a sketch on a napkin — but a sketch with rules you can inspect, assumptions you can challenge, and parameters you can twist.</p>

<hr />

<h2 id="the-30-question">The 30% Question</h2>

<blockquote>
  <p><strong>Takeaway:</strong> The headline result is real but easy to overread: the convenience-oriented preset bundle costs about 30% more total labor, but delegation alone explains only a much smaller share of that gap.</p>
</blockquote>

<p>The first thing the model told me was a number: <strong>30%</strong>.</p>

<p>Type B societies — or more precisely, the full Type B preset bundle of higher delegation, cheaper services, stronger conformity, and heavier task load — generate approximately 30% more total system labor than Type A societies. Not 30% more output. Not 30% more productivity. Thirty percent more <em>hours worked across all agents combined</em>.</p>

<p>This gap appears at simulation step 120 (31.1%) and is still there at step 450 (30.0%). It is not a warm-up artifact or a transient fluctuation. Run the simulation for 120 days or 450 days — the preset-level premium holds steady. But the dramatic number needs a narrower reading than I first gave it. Horizon stability tells us the Type A / Type B gap is structural. It does <strong>not</strong> tell us delegation alone caused the whole thing. The two presets differ on several parameters, most importantly task load (2.2 vs 2.8 tasks per step). In decomposition runs, once Type B’s task load is aligned back to 2.2, the remaining labor premium shrinks to roughly <strong>3–4%</strong>. <strong>The 30% number survives. The interpretation changes.</strong></p>

<p><strong>Figure 2 — Type A and Type B remain structurally different across longer horizons</strong></p>

<figure style="margin:1.75rem auto 1.4rem auto; width:100%; max-width:1040px;"><div style="background:#ffffff; border:1px solid #e5e7eb; border-radius:14px; padding:18px 18px 14px 18px; box-shadow:0 1px 2px rgba(15,23,42,0.06);"><img src="/Social-Complexity-Insights/assets/images/blog-social-systems-03-toy-world-convenience/fig-horizon-panel.svg" alt="Six-panel comparison showing total labor hours, average stress, final available time, delegated task share, income inequality (Gini), and time inequality (Gini) for Type A and Type B presets across simulation horizons of 120, 200, 300, and 450 steps. The labor gap and stress gap remain stable throughout." width="1040" loading="lazy" style="display:block; width:100%; max-width:1040px; height:auto; margin:0 auto;" /></div></figure>

<p>The six panels above track the gap across four time horizons. Total labor hours: consistently higher for Type B (~566h vs ~435h). Average stress: persistently elevated (0.052 vs 0.039). Available time at day’s end: Type A agents retain about 3.65 hours — 46% of their 8-hour budget — while Type B agents retain 2.46 hours, just 31%. Delegation rates: 8.9% versus 64.5%, a sharp and stable separation that shows these two configurations inhabit fundamentally different behavioral regimes.</p>

<p>But the population average hides individual variation. What does the gap look like at the agent level?</p>

<p><strong>Figure 3 — Available time distribution at final step</strong></p>

<figure style="margin:1.75rem auto 1.4rem auto; width:100%; max-width:760px;"><div style="background:#ffffff; border:1px solid #e5e7eb; border-radius:14px; padding:18px 18px 14px 18px; box-shadow:0 1px 2px rgba(15,23,42,0.06);"><img src="/Social-Complexity-Insights/assets/images/blog-social-systems-03-toy-world-convenience/fig-available-time-density.svg" alt="Overlapping histogram showing the distribution of remaining daily hours for Type A (blue, centered around 3.7 hours with wide spread) and Type B (red, centered around 2.5 hours with tighter clustering)." width="760" loading="lazy" style="display:block; width:100%; max-width:760px; height:auto; margin:0 auto;" /></div></figure>

<p>Type A agents spread widely across the time axis — some have barely an hour left, others have nearly 6. Their strategies are diverse, their outcomes heterogeneous. Type B agents cluster tightly around 2.5 hours. Conformity pressure homogenizes their outcomes: high social pressure does not just shift the average, it <em>narrows the distribution</em>. The convenience-oriented society does not just have less free time on average — it has less <em>variance</em> in free time. The norm flattens everyone to the same compressed rhythm.</p>

<p>In my previous blog, I described the closed supermarket as a friction that <em>felt</em> like a flaw but might signal something deeper. In the model, that friction corresponds not just to lower delegation in the abstract, but to a lower-delegation, lower-task-pressure preset world — and that world uses about 30% less total system labor and preserves nearly 50% more retained personal time. <strong>The inconvenience was not a bug. It was a trace of a different time-allocation architecture.</strong></p>

<hr />

<h2 id="the-cliff-at-30">The Cliff at 3.0</h2>

<blockquote>
  <p><strong>Takeaway:</strong> The system does not degrade smoothly under pressure; it crosses a narrow threshold and flips from stable operation into backlog-driven overload.</p>
</blockquote>

<p>The 30% gap is striking but static — a comparison between two stable configurations. The next question is dynamic: <em>what happens when you turn up the pressure?</em> Is the transition from manageable to overloaded gradual, or is there a tipping point?</p>

<p>I ran a systematic parameter sweep across delegation preference (0.05 to 0.95) and daily task load (1.5 to 5.5 tasks per step), mapping total labor hours across the full parameter space. Each cell in the resulting grid represents the average of multiple simulation runs. The result is a phase atlas — a map of the system’s behavioral landscape. And it contains a cliff.</p>

<p><strong>Figure 4 — Delegation-task load phase atlas: backlog emergence</strong></p>

<figure style="margin:1.75rem auto 1.4rem auto; width:100%; max-width:920px;"><div style="background:#ffffff; border:1px solid #e5e7eb; border-radius:14px; padding:18px 18px 14px 18px; box-shadow:0 1px 2px rgba(15,23,42,0.06);"><img src="/Social-Complexity-Insights/assets/images/blog-social-systems-03-toy-world-convenience/fig-phase-atlas.svg" alt="Heatmap showing total labor hours across delegation preference (x-axis) and task load (y-axis). Three regimes visible: a cool-colored safe zone at bottom, a narrow warm transition band around 3.0-3.25 tasks/step, and a deep red overloaded regime above. Dashed lines mark the transition band boundaries." width="920" loading="lazy" style="display:block; width:100%; max-width:920px; height:auto; margin:0 auto;" /></div></figure>

<p>Three regimes emerge cleanly from the data. Below roughly 3.0 tasks per step, everything is manageable — backlogs stay at zero regardless of how much the population delegates. This is the <strong>safe zone</strong>: even high-delegation societies can function here because the demand on service providers does not exceed their available capacity. Between 3.0 and 3.25, the system enters a narrow <strong>transition band</strong> where the first backlogs appear — tasks that go unmatched because no provider has enough remaining time. Above 3.25, high-delegation configurations spiral into <strong>catastrophic overload</strong>.</p>

<p>The transition is not a gentle slope. It is roughly 0.25 task-load units wide — a cliff, not a hill. This is classic phase-transition behavior from complexity science: the system does not gradually worsen; it flips regimes across a narrow boundary.</p>

<p>To make this tangible, I tracked four “story cases” through time — each representing a distinct point in the parameter space.</p>

<p><strong>Figure 5 — System dynamics: four story cases from relief to overload</strong></p>

<figure style="margin:1.75rem auto 1.4rem auto; width:100%; max-width:1040px;"><div style="background:#ffffff; border:1px solid #e5e7eb; border-radius:14px; padding:18px 18px 14px 18px; box-shadow:0 1px 2px rgba(15,23,42,0.06);"><img src="/Social-Complexity-Insights/assets/images/blog-social-systems-03-toy-world-convenience/fig-story-timeseries.svg" alt="Six-panel timeseries showing average stress, total labor hours, backlog tasks, delegation match rate, delegation preference, and service labor hours across 300 steps for four scenarios. The overloaded convenience case shows stress saturating at 1.0 within approximately 50 steps, backlog growing exponentially, and total labor hitting the 800-hour ceiling." width="1040" loading="lazy" style="display:block; width:100%; max-width:1040px; height:auto; margin:0 auto;" /></div></figure>

<p>The <strong>autonomy baseline</strong> hums along quietly: stress 0.034, total labor 428 hours, zero backlog. A society that mostly takes care of itself. The <strong>convenience baseline</strong> is costlier but stable: stress 0.052, total labor 567 hours, still zero backlog. The system absorbs the overhead of delegation without breaking. The <strong>threshold-pressure case</strong> teeters at the edge: stress rises to 0.189, intermittent backlogs appear and recede, the system oscillates near its breaking point.</p>

<p>Then the <strong>overloaded case</strong>. Stress saturates at 1.0 — the maximum — within approximately 50 simulated days. Backlog grows exponentially, reaching 133,788 unmatched tasks by the simulation’s tail window. Total labor hits 800 hours, meaning every single agent is working every available minute of every day. This is involution in its precise Geertzian sense: intensification without development. The system is busier than it has ever been. No one is better off.</p>

<!-- ILLUSTRATION 3: "The Narrow Cliff"
Caption: "Between 3.0 and 3.25 tasks per step, the world changes. Not a slope — a cliff."
Generation prompt: "Sketchnote illustration, hand-drawn style, warm earth tones. A horizontal landscape: on the left, a gentle green field with small figures going about their day (safe zone). In the center, a very narrow band of crumbling orange-red ground (transition). On the right, a steep drop-off into a chaotic scene below: tangled task piles, stressed figures, clocks spinning. A small sign near the cliff reads '3.0'. The transition is visually narrow — just a sliver. Clean, conceptual, not literal." -->

<figure style="margin:1.85rem auto 1.7rem auto; width:100%; max-width:960px;"><div style="background:#ffffff; border:1px solid #e5e7eb; border-radius:14px; padding:18px 18px 14px 18px; box-shadow:0 1px 2px rgba(15,23,42,0.06);"><img src="/Social-Complexity-Insights/assets/images/blog-social-systems-03-toy-world-convenience/illustration-3.png" alt="Sketchnote-style landscape showing a narrow transition band between a safe zone and a steep overload cliff around 3.0 tasks per step." width="960" loading="lazy" style="display:block; width:100%; max-width:960px; height:auto; margin:0 auto;" /></div><figcaption style="margin-top:0.9rem; font-size:0.98rem; line-height:1.6; color:#475569; text-align:center;"><strong style="color:#0f172a;">Illustration 3 — The Narrow Cliff.</strong> Between 3.0 and 3.25 tasks per step, the world changes. Not a slope — a cliff.</figcaption></figure>

<hr />

<h2 id="where-did-the-time-go">Where Did the Time Go?</h2>

<blockquote>
  <p><strong>The threshold tells us when the system breaks. The labor decomposition tells us how the system has already changed before it breaks.</strong></p>
</blockquote>

<blockquote>
  <p><strong>Takeaway:</strong> Even before collapse, convenience rewires the labor budget: self-service shrinks, provider work expands, and coordination overhead quietly absorbs the claimed time savings.</p>
</blockquote>

<p><strong>Figure 6 — Labor composition: convenience reshapes before it overloads</strong></p>

<figure style="margin:1.75rem auto 1.4rem auto; width:100%; max-width:920px;"><div style="background:#ffffff; border:1px solid #e5e7eb; border-radius:14px; padding:18px 18px 14px 18px; box-shadow:0 1px 2px rgba(15,23,42,0.06);"><img src="/Social-Complexity-Insights/assets/images/blog-social-systems-03-toy-world-convenience/fig-labor-decomposition.svg" alt="Stacked bar chart showing labor hours decomposed into self-labor (blue), service labor (green), and coordination overhead (yellow) for four cases: Autonomy Baseline, Convenience Baseline, Threshold Pressure, and Overloaded Convenience. An orange line tracks the delegation labor delta. The convenience baseline shows self-labor dropping from 89% to 31% of total, while total hours increase by 30%." width="920" loading="lazy" style="display:block; width:100%; max-width:920px; height:auto; margin:0 auto;" /></div></figure>

<p>Look at the autonomy baseline first. Self-labor accounts for 380.2 of 428.3 total hours — roughly 89% of all work. Service labor is a thin slice (45.0 hours), coordination overhead barely visible (3.1 hours). People mostly handle their own tasks. The system is quiet, simple, self-contained.</p>

<p>Now look at the convenience baseline — still a <em>stable</em>, non-overloaded system, well within the safe zone. The composition has fundamentally changed. Self-labor drops to 177.3 hours — just 31% of the total. Service labor balloons to 361.4 hours. Coordination overhead grows ninefold to 28.1 hours. Total: 566.8 hours. That is 138.5 hours more than the autonomy baseline, for the same population operating under a busier preset bundle.</p>

<p>Where did the extra 138.5 hours come from? Not from one source alone. Part of it comes from the fact that the convenience baseline is asked to handle a heavier task load in the first place. Part comes from what delegation does to those tasks once they are outsourced. Every delegated task incurs a <strong>15% coordination cost</strong> — matching agents to tasks, communication overhead, handoff friction. Providers handling <em>someone else’s</em> task work at roughly <strong>0.6 proficiency</strong> — because they do not know your kitchen layout, your filing system, or your definition of “done.” That means every delegated hour costs approximately 1.67 provider-hours. These overheads are individually modest. Collectively, they help explain why the equal-task-load delegation premium stays positive, while the much larger published 30% gap belongs to the whole preset architecture rather than delegation alone.</p>

<p>The dual-role design makes this vivid. Imagine Alice delegates her cooking (0.8 hours) to save time. She is then matched as a provider for Bob’s errand, spending 0.83 hours at reduced proficiency. Net personal time saved: negative 0.03 hours. Bob delegates his errand (0.5 hours) to save time, then provides Alice’s cooking for 1.33 hours. Net: negative 0.83 hours. Both acted individually rationally. Both ended the day with less free time than if they had simply done their own tasks.</p>

<!-- ILLUSTRATION 4: "The Pipe Diagram"
Caption: "The time you saved by delegating does not vanish. It flows through a pipe into someone else's workday — with a 26% surcharge."
Generation prompt: "Sketchnote illustration, hand-drawn style, warm earth tones. A person on the left hands a task card to a central pipe/funnel. The pipe has two visible leaks: one labeled 'coordination cost' (dripping 15%), one labeled 'provider overhead' (dripping 11%). On the right, a provider figure catches a larger bucket of water (time) than what went in. Small clock icons show the time accounting. Abstract, diagrammatic, like a science notebook sketch." -->

<figure style="margin:1.85rem auto 1.7rem auto; width:100%; max-width:960px;"><div style="background:#ffffff; border:1px solid #e5e7eb; border-radius:14px; padding:18px 18px 14px 18px; box-shadow:0 1px 2px rgba(15,23,42,0.06);"><img src="/Social-Complexity-Insights/assets/images/blog-social-systems-03-toy-world-convenience/illustration-4.png" alt="Sketchnote-style pipe diagram showing delegated time flowing through coordination and provider-overhead leaks into a larger provider workload." width="960" loading="lazy" style="display:block; width:100%; max-width:960px; height:auto; margin:0 auto;" /></div><figcaption style="margin-top:0.9rem; font-size:0.98rem; line-height:1.6; color:#475569; text-align:center;"><strong style="color:#0f172a;">Illustration 4 — The Pipe Diagram.</strong> The time you saved by delegating does not vanish. It flows through a pipe into someone else's workday — with a 26% surcharge.</figcaption></figure>

<p>In the companion blog, I asked whether convenience was saving labour or relocating it. In this toy world, the sharper answer is: relocating it, with overhead. At fixed task load, delegation still adds a smaller positive labor premium. Across the full Type A / Type B comparison, that transfer is amplified by the fact that the convenience-oriented world is also busier to begin with. The time you reclaim by outsourcing does not vanish from the system. It reappears as someone else’s workday — slightly larger than what you gave up.</p>

<hr />

<h2 id="the-cheap-service-trap">The Cheap Service Trap</h2>

<blockquote>
  <p><strong>Takeaway:</strong> Lower prices are not unconditionally beneficial; they relieve stress in slack systems and intensify overload in systems already near capacity.</p>
</blockquote>

<p>The previous blog posed another question I kept turning over: <em>is the low price a cause or a consequence of the convenience ecosystem?</em> The model cannot answer this directly — service cost is an exogenous parameter, set by the experimenter, not determined by supply and demand. But it can show us what cheap prices <em>do</em> inside the system once they exist. And what they do turns out to be context-dependent in a way that verbal intuition struggles to anticipate.</p>

<p><strong>Figure 7 — Service cost is conditional: relief at low load, amplification near threshold</strong></p>

<figure style="margin:1.75rem auto 1.4rem auto; width:100%; max-width:1040px;"><div style="background:#ffffff; border:1px solid #e5e7eb; border-radius:14px; padding:18px 18px 14px 18px; box-shadow:0 1px 2px rgba(15,23,42,0.06);"><img src="/Social-Complexity-Insights/assets/images/blog-social-systems-03-toy-world-convenience/fig-cost-sensitivity.svg" alt="Two-panel figure. Left panel: dot plot comparing tail average stress under low-cost and high-cost conditions across five contexts (Default, Edge, Overloaded, Type A, Type B). Right panel: line chart showing the task-load level at which low cost flips from stress-reducing to stress-amplifying, hovering around 3.0-3.5 across delegation preferences." width="1040" loading="lazy" style="display:block; width:100%; max-width:1040px; height:auto; margin:0 auto;" /></div></figure>

<p>At low task loads, cheaper services modestly reduce stress — they make delegation accessible and the system absorbs it easily. At moderate loads, the difference between cheap and expensive services is negligible. But near the threshold band (task load 3.0–3.5), something counterintuitive happens: cheaper services <em>amplify</em> overload. The mechanism is straightforward once you see it: lower prices remove the economic brake on delegation, encouraging more agents to delegate more tasks, which floods the service pool beyond provider capacity. Backlogs build. Stress rises. <strong>The very cheapness that was supposed to relieve pressure creates it.</strong></p>

<p>The same lever — lowering price — produces opposite effects depending on where you stand relative to the system’s capacity threshold. Relief below the cliff, amplification above it. This is a hallmark of nonlinear systems, and it is exactly the kind of insight that verbal reasoning alone struggles to produce. You cannot intuit your way through a feedback loop with three interacting variables and a phase transition. You need to run the computation.</p>

<blockquote>
  <p><strong>Cheap services help below the threshold and hurt near it.</strong> That is the kind of reversal nonlinear systems produce.</p>
</blockquote>

<p>This finding also reframes a policy intuition that feels obvious: “make services cheaper and people will be better off.” In this model, that is true only when the system has spare capacity. When it does not — when every provider is already close to their time limit — cheaper services are like widening the entrance to a stadium that is already full. More people get through the gate, but the crush inside gets worse.</p>

<hr />

<h2 id="what-the-model-cannot-say">What the Model Cannot Say</h2>

<blockquote>
  <p><strong>Takeaway:</strong> The most useful result here is partly negative: the current mechanism can compare preset worlds and detect thresholds, but it still cannot generate the full norm cascade or causal loop the broader argument ultimately needs.</p>
</blockquote>

<p>Here is where I owe you honesty — and where the story becomes, I think, most interesting.</p>

<p>I expected mixed systems — societies starting with moderate delegation preferences around 0.50 — to be unstable. The hypothesis was that social conformity would amplify small random differences: a few agents who happen to delegate more would pull their neighbors toward delegation, creating local clusters that expand, until the whole society tips toward one extreme or the other. A norm cascade. A bifurcation. The middle, unable to hold.</p>

<p><strong>It did not happen.</strong> Across a mixed-state parameter space spanning starting delegation preferences from <strong>0.35 to 0.65</strong> and conformity pressures from <strong>0.1 to 0.9</strong>, the maximum standard deviation in final delegation rates was only <strong>0.0125</strong> on a 0-to-1 scale. <strong>The middle held. Mixed systems stayed mixed.</strong> There was no bifurcation, no cascade, no dramatic tipping point in the social norm dimension.</p>

<p><strong>Figure 8 — Mixed-system stability: the middle holds</strong></p>

<figure style="margin:1.75rem auto 1.4rem auto; width:100%; max-width:760px;"><div style="background:#ffffff; border:1px solid #e5e7eb; border-radius:14px; padding:18px 18px 14px 18px; box-shadow:0 1px 2px rgba(15,23,42,0.06);"><img src="/Social-Complexity-Insights/assets/images/blog-social-systems-03-toy-world-convenience/fig-mixed-stability.svg" alt="Heatmap showing the standard deviation of final delegation rates across mixed-start conditions and conformity levels. The values remain uniformly low across the tested parameter space, indicating stable mixed outcomes rather than bifurcation." width="760" loading="lazy" style="display:block; width:100%; max-width:760px; height:auto; margin:0 auto;" /></div></figure>

<figure style="margin:1.75rem auto 1.4rem auto; width:100%; max-width:760px;"><div style="background:#ffffff; border:1px solid #e5e7eb; border-radius:14px; padding:18px 18px 14px 18px; box-shadow:0 1px 2px rgba(15,23,42,0.06);"><img src="/Social-Complexity-Insights/assets/images/blog-social-systems-03-toy-world-convenience/fig-mixed-stability-scatter.svg" alt="Scatter plot showing per-seed final delegation rates versus initial delegation preference across mixed-start conditions and conformity levels. Outcomes cluster tightly near the identity line, with no visible drift toward extremes." width="760" loading="lazy" style="display:block; width:100%; max-width:760px; height:auto; margin:0 auto;" /></div></figure>

<p>The two panels show this in different ways. The heatmap says there is no hidden unstable corner in the broader space: across all <strong>30</strong> parameter combinations, dispersion stays low, and the cell-to-cell variation is barely visible. The scatter says the same thing at the run level: final delegation rates cling to the identity line, meaning they end up very close to where they started, even under the strongest conformity setting. This is perhaps the model’s most important finding — and it is a <em>negative</em> one. The current mechanism design cannot produce the norm cascade I anticipated. Why? The conformity mechanism is too symmetric: it pulls toward the local mean equally from both sides, rather than amplifying deviations. The adaptation rate is too slow relative to the simulation horizon. There is no skill decay — agents who stop self-serving do not lose their ability to self-serve. And the starting conditions are still fairly homogeneous, which makes large divergence harder to trigger in the first place. In reality, they might not be. A generation that never cooks may lose the skill entirely, making delegation not a preference but a structural necessity. A neighborhood where every restaurant assumes delivery as the default may see sit-down options disappear, making non-delegation physically harder. Those mechanisms are absent from this model.</p>

<p><strong>Figure 9 — Hypothesis verdict matrix</strong></p>

<table>
  <thead>
    <tr>
      <th>hypothesis</th>
      <th>judgment</th>
      <th>evidence</th>
      <th>interpretation</th>
    </tr>
  </thead>
  <tbody>
    <tr>
      <td>H1</td>
      <td>Strong support (preset level); modest positive equal-load effect</td>
      <td>Type B maintains a 30.0% preset-bundle labor premium at 450 steps; with task load aligned, the gap shrinks to ~3–4%.</td>
      <td>Convenience-oriented preset bundles use more total labor overall; delegation alone adds a smaller positive premium that grows near the threshold band.</td>
    </tr>
    <tr>
      <td>H2</td>
      <td>Strong support</td>
      <td>Threshold band at task load 3.10, refined to 3.0-3.25.</td>
      <td>A narrow overload band precedes the high-backlog regime.</td>
    </tr>
    <tr>
      <td>H3</td>
      <td>Partial support</td>
      <td>Type A retains 3.65h vs 2.46h for Type B.</td>
      <td>Autonomy preserves more personal time; convenience is not directly measured.</td>
    </tr>
    <tr>
      <td>H4</td>
      <td>Partial (important negative)</td>
      <td>Max mixed-state std = 0.0125.</td>
      <td>Moderate instability, but no dramatic bifurcation under current parameters.</td>
    </tr>
  </tbody>
</table>

<p>A model that honestly reports what it cannot find is more useful than one that overclaims what it did. This toy world can confidently compare preset worlds. It can show that convenience-oriented bundles use more total labor overall, and that at fixed task load higher delegation is associated with a smaller positive labor premium. It can compare how stress, inequality, and labor composition evolve under different configurations. It can test whether moderate delegation states remain stable under the current rules. But it <em>cannot</em> identify the full causal loop between cheap services and service dependence — because prices are not endogenous. It cannot measure real populations or name specific societies. And it cannot claim that delegation alone explains the full published 30% gap. Skill decay, demographic inequality, and how speed expectations form and harden are simply not in the code.</p>

<blockquote>
  <p><strong>The boundary between what a model <em>can</em> say and what it <em>cannot</em> is not a weakness to hide. It is the most informative part of the map.</strong></p>
</blockquote>

<!-- ILLUSTRATION 5: "The Map with Edges"
Caption: "Every model is a map. The useful ones show you where the edges are."
Generation prompt: "Sketchnote illustration, hand-drawn style, warm earth tones. A stylized map viewed from above. The center shows a detailed, filled-in area labeled 'what we modeled' with small icons (agents, tasks, delegation arrows). The edges are deliberately torn or faded, with handwritten labels pointing outward: 'skill decay?', 'endogenous prices?', 'delay tolerance?', 'real populations?'. Small question marks at the borders. Warm, inviting, like a cartographer's working draft." -->

<figure style="margin:1.85rem auto 1.7rem auto; width:100%; max-width:960px;"><div style="background:#ffffff; border:1px solid #e5e7eb; border-radius:14px; padding:18px 18px 14px 18px; box-shadow:0 1px 2px rgba(15,23,42,0.06);"><img src="/Social-Complexity-Insights/assets/images/blog-social-systems-03-toy-world-convenience/illustration-5.png" alt="Sketchnote-style map with a detailed modeled center and torn edges labeled with open questions such as skill decay and endogenous prices." width="960" loading="lazy" style="display:block; width:100%; max-width:960px; height:auto; margin:0 auto;" /></div><figcaption style="margin-top:0.9rem; font-size:0.98rem; line-height:1.6; color:#475569; text-align:center;"><strong style="color:#0f172a;">Illustration 5 — The Map with Edges.</strong> Every model is a map. The useful ones show you where the edges are.</figcaption></figure>

<hr />

<h2 id="back-to-the-supermarket">Back to the Supermarket</h2>

<blockquote>
  <p><strong>Takeaway:</strong> The toy world does not settle the real-world debate, but it turns a vague intuition about convenience into a clearer map of labor premiums, thresholds, overheads, and missing mechanisms.</p>
</blockquote>

<p>I started this exploration standing in front of a closed door on a Sunday afternoon, grocery bag in hand, feeling a small friction. That friction turned out to be a thread — and the thread led here, to a toy world where 100 agents navigate the same tension between doing things yourself and having someone else do them for you.</p>

<p>What did the toy world teach me?</p>

<p>Five points stood out:</p>

<ul>
  <li><strong>Convenience-oriented preset bundles are not free.</strong> In this model, they generate about 30% more total labor than autonomy-oriented ones — a structural premium that appears immediately and persists indefinitely. But most of that dramatic gap belongs to the whole preset bundle, not to delegation alone: the convenience world is also busier to begin with, and once task load is aligned the remaining delegation premium is much smaller, on the order of 3–4%.</li>
  <li><strong>There is a narrow threshold separating manageable systems from catastrophic spirals.</strong> The transition is a cliff, not a slope.</li>
  <li><strong>Convenience reshapes the composition of labor <em>before</em> it overloads the system.</strong> Self-service drops from 89% to 31% of total work, and the gap is filled with service labor and coordination overhead that did not previously exist.</li>
  <li><strong>Cheap services help until they do not.</strong> Near the threshold, lower prices amplify the very overload they were meant to relieve.</li>
  <li><strong>The norm cascade I expected did not materialize.</strong> That negative result points honestly toward the mechanisms I still need to build.</li>
</ul>

<p>These are not conclusions about the real world. They are conclusions about a toy world with stated rules and known limitations — a world where providers never specialize, prices never change, and no one ever forgets how to cook. Reality is messier, richer, and more surprising than any model I can build on a laptop.</p>

<p>But the toy world gave me something the previous blog post could not: a <em>vocabulary</em> for the dynamics I observed. Feedback loops with names. Thresholds with coordinates. Labor budgets with ledgers. A way to say, more precisely, that the published 30% gap belongs to an entire architecture — a busier world whose tasks are then routed through coordination costs and provider inefficiency — rather than vaguely gesturing at “hidden costs of convenience.”</p>

<p>More importantly, it taught me what questions to ask next. The norm cascade that did not appear tells me the model needs skill decay — the realistic possibility that a generation which outsources everything gradually loses the ability to do things themselves, turning choice into dependency. It needs endogenous prices — markets that respond to demand, creating the circular causality between cheap services and service dependence that my previous blog post described. It needs delay tolerance — the mechanism by which societies develop speed expectations that, once established, make slower alternatives feel unacceptable even when they are available.</p>

<p>When I stood in front of that closed supermarket door, I was seeing the surface of a system. Now I can sketch what might be underneath. The sketch is rough, the edges are torn, and the most interesting territories — the ones where culture, infrastructure, and individual habit reinforce each other until the system feels like nature rather than design — remain just beyond the map.</p>

<blockquote>
  <p><strong>That is not a failure. That is where the next model begins.</strong></p>
</blockquote>

<!-- ILLUSTRATION 6: "Two Rhythms, Revisited"
Caption: "The same two neighborhoods. Now you can see the loops underneath."
Generation prompt: "Sketchnote illustration, hand-drawn style, warm earth tones. Same split composition as Illustration 1 (two neighborhoods), but now with faint, translucent causal-loop arrows overlaid: on the left side, a small visible loop (self-reliance → skill → less delegation). On the right side, a larger, more complex loop (delegation → provider burden → less time → more stress → more delegation). The arrows are lighter, almost ghostly. The neighborhoods look the same; the loops are the new layer." -->

<figure style="margin:1.85rem auto 1.7rem auto; width:100%; max-width:960px;"><div style="background:#ffffff; border:1px solid #e5e7eb; border-radius:14px; padding:18px 18px 14px 18px; box-shadow:0 1px 2px rgba(15,23,42,0.06);"><img src="/Social-Complexity-Insights/assets/images/blog-social-systems-03-toy-world-convenience/illustration-6.png" alt="Sketchnote-style revisited two-neighborhood scene with faint causal loops overlaid, showing self-reliance on one side and delegation stress loops on the other." width="960" loading="lazy" style="display:block; width:100%; max-width:960px; height:auto; margin:0 auto;" /></div><figcaption style="margin-top:0.9rem; font-size:0.98rem; line-height:1.6; color:#475569; text-align:center;"><strong style="color:#0f172a;">Illustration 6 — Two Rhythms, Revisited.</strong> The same two neighborhoods. Now you can see the loops underneath.</figcaption></figure>

<hr />

<p><em>This model explores abstract social dynamics and is not intended to characterize or evaluate any specific society, culture, or nation. All experiments use abstract Type A / Type B labels. The simulation engine, data, and analysis code are available in the <a href="https://github.com/stevenbush/Convenience-Paradox">project repository</a>. For the detailed formal report of the experimental methodology and complete results, see the companion research report.</em></p>

<p>*Built with <a href="https://mesa.readthedocs.io/">Mesa</a> (Python ABM framework) · 14,656 simulation runs · 4 research packages</p>]]></content><author><name>Jiyuan Shi</name></author><summary type="html"><![CDATA[Pulling the Thread]]></summary></entry><entry><title type="html">Simulating Society in the Age of AI: A Systems Thinker’s Field Notes</title><link href="https://stevenbush.github.io/Social-Complexity-Insights/2026/03/31/simulating-society-age-of-ai/" rel="alternate" type="text/html" title="Simulating Society in the Age of AI: A Systems Thinker’s Field Notes" /><published>2026-03-31T00:00:00+08:00</published><updated>2026-03-31T00:00:00+08:00</updated><id>https://stevenbush.github.io/Social-Complexity-Insights/2026/03/31/simulating-society-age-of-ai</id><content type="html" xml:base="https://stevenbush.github.io/Social-Complexity-Insights/2026/03/31/simulating-society-age-of-ai/"><![CDATA[<p><strong>Figure 1 — Where two worlds converge: simulation science meets the generative AI era</strong></p>

<p><img src="/Social-Complexity-Insights/assets/images/blog-social-systems-02-simulating-society-age-of-ai/fig01-opening-hero-simulating-society-age-of-ai.png" alt="Opening hero: agent-based modeling, generative AI, and urban society as a single visual story—scale, interaction, and the hybrid human–machine frontier." /></p>

<hr />

<h2 id="the-spark">The Spark</h2>

<p>A few years ago, I watched a cellular automaton demo — Rule 30, one of Stephen Wolfram’s favorites — and something clicked. Here was a system governed by a rule so simple you could write it on a napkin, yet the patterns it produced were wild, unpredictable, and eerily reminiscent of real-world chaos. Wolfram called this <em>computational irreducibility</em>: for certain complex systems, there is no shortcut. You cannot predict the outcome without actually running the computation, step by step. The only way to know what happens is to let it play out.</p>

<p>That idea lodged itself in my brain and never left.</p>

<p>I come from a background in systems design and optimization — data center resource management, embedded AI, heterogeneous SoC architecture simulation. My daily work involves building models of complicated machines and finding ways to make them run better. But increasingly, I’ve found myself drawn to a different kind of system. Not silicon. Not software stacks. People. Communities. Societies.</p>

<p>Agent-based modeling (ABM) offers a framework for doing exactly this: you define individual agents with their own rules, drop them into an environment, and watch what emerges. It’s the computational equivalent of asking, “What happens when a million small decisions collide?” And the answers, much like Wolfram’s cellular automata, are often surprising.</p>

<p><strong>Figure 2 — From simple rules to complex societies</strong></p>

<p><img src="/Social-Complexity-Insights/assets/images/blog-social-systems-02-simulating-society-age-of-ai/fig02-from-simple-rules-to-complex-societies.png" alt="Rule 30–style cellular patterns dissolve into an agent network and a miniature cityscape: computational irreducibility as a bridge from toy rules to social-scale emergence." /></p>

<p>But here’s what makes this moment different from any that came before. ABM has been around for decades. What’s new is a collision of forces — generative AI, massive GPU compute, and differentiable simulation frameworks — that is fundamentally reshaping what these models can do and what they mean. And at the same time, a quieter but more profound shift is underway: AI agents are no longer just tools for <em>simulating</em> society. They are becoming <em>participants</em> in it.</p>

<p>Consider a thought experiment. <em>A Tuesday afternoon in 2028. A product team at a mid-sized tech company is negotiating next quarter’s budget — but nobody is in the same room. Each team lead has spent twenty minutes that morning briefing their personal AI agent: priorities, red lines, acceptable trade-offs. The agents spend three hours negotiating with each other — proposing, counter-proposing, escalating sticking points back to their human principals. By 4 PM, a draft allocation lands in everyone’s inbox.</em></p>

<p><strong>Figure 3 — When humans brief agents: from the meeting room to agent-to-agent negotiation</strong></p>

<p><img src="/Social-Complexity-Insights/assets/images/blog-social-systems-02-simulating-society-age-of-ai/fig03-conference-room-to-agent-negotiation-network.png" alt="Split scene: a traditional conference-room negotiation transitions into a network of AI agents exchanging messages and converging on a shared draft agreement." /></p>

<p>Science fiction? The pieces are already on the table. LLM-based agents can negotiate and coordinate in constrained strategic settings. Researchers have built multi-agent societies of thousands with emergent norms and social dynamics. We are at the beginning of understanding what happens when the boundary between “simulation subject” and “real-world actor” starts to dissolve.</p>

<p>That dual realization — that we’re simultaneously building better tools for studying society <em>and</em> reshaping the society being studied — is what pulled me into this space. After digging into the literature and stress-testing my intuitions against what I know about systems engineering, I want to share some observations. Not as an expert in computational social science, but as a systems thinker who sees structural parallels and open questions that deserve more attention.</p>

<p>Here’s the map as I see it: three forces converging on ABM right now — better interaction, bigger scale, smarter agents — plus a wild card (<em>When AI Agents Join Human Society</em>) that could reshape the whole game. But the story that ties them together isn’t the one you’d expect.</p>

<hr />

<h2 id="the-obvious-story--and-why-its-incomplete">The Obvious Story — and Why It’s Incomplete</h2>

<p>When you first survey ABM in the generative AI era, three directions jump out:</p>

<p><strong>Make it more visual and interactive.</strong> Social simulations ultimately serve human understanding. If the results can’t be explored and questioned by people, the simulation is a black box with extra steps.</p>

<p><strong>Make it bigger and richer.</strong> Many phenomena — tipping points, emergent norms, cascade failures — only materialize at sufficient scale. Wolfram’s computational irreducibility gives theoretical weight to this: if you must <em>run</em> the system to see what happens, fidelity depends critically on scale.</p>

<p><strong>Make the agents smarter.</strong> With LLMs capable of reasoning and communicating in natural language, the temptation is obvious: replace rule-based agents with AI-powered ones that can <em>think</em>, <em>talk</em>, and <em>adapt</em>.</p>

<p>These directions are real and well-supported. But after deeper investigation, I’ve come to believe this “bigger, smarter, prettier” narrative misses the most important part of the story.</p>

<blockquote>
  <p>The real frontier isn’t about making simulations bigger or agents cleverer. It’s about making the entire research process <em>trustworthy</em>.</p>
</blockquote>

<p><strong>Figure 4 — The real axis: trustworthiness across visual, scale, and intelligence</strong></p>

<p><img src="/Social-Complexity-Insights/assets/images/blog-social-systems-02-simulating-society-age-of-ai/fig04-trustworthiness-as-the-real-axis.png" alt="Conceptual diagram: upward arrows for visualization, scale, and smarter agents are crossed by a dominant horizontal arrow for trustworthiness—the progress that actually matters for scientific use." /></p>

<p>Classical ABM often treated the model as the main deliverable: build it, run it, plot the output, write a paper. But the field has been quietly shifting toward a layered <em>research stack</em>:</p>

<p><strong>Source ingestion</strong> → <strong>Concept extraction</strong> → <strong>Model specification</strong> → <strong>Simulation</strong> → <strong>Calibration &amp; sensitivity</strong> → <strong>Validation</strong> → <strong>Interactive interpretation</strong> → <strong>Reproducibility &amp; audit</strong></p>

<p>Each layer can fail independently. A simulation might produce beautiful emergent behavior and still be scientifically useless — because the input data was silently biased, the calibration overfitted while ignoring subgroups, or the “emergent” pattern was an artifact of a poorly specified rule.</p>

<p>This reframing matters because many criticisms of ABM — “it’s just a toy,” “you can make it produce anything” — are really about weak upstream mapping or absent downstream validation, not the simulation paradigm itself. Once you see ABM as a stack, the question shifts from <em>“How big can we build?”</em> to <em>“How accountable can we make every layer?”</em></p>

<p>For someone with a systems engineering background, this feels like coming home. It’s the same thinking that distinguishes a prototype from a production system: the core computation may be identical, but the observability, testing, provenance, and failure-handling infrastructure is what makes it trustworthy.</p>

<p>With that framing, let me walk through the three forces — and the wild card — with a sharper lens.</p>

<hr />

<h2 id="force-1-making-the-invisible-visible">Force #1: Making the Invisible Visible</h2>

<p>Let’s start with something that sounds obvious but is surprisingly hard: making simulation results understandable to humans.</p>

<p>ABM simulations can produce staggering amounts of data — millions of agents, billions of interactions, sprawling parameter spaces. But the consumers of these insights are people: policymakers, urban planners, researchers. If the output is a wall of numbers only a specialist can parse, we’ve won the battle of computation and lost the war of understanding.</p>

<p>This is not just a visualization problem. It’s an <em>interaction design</em> problem.</p>

<p>The ABM community already has capable tools — Mesa’s browser-based dashboards, GAMA Platform’s spatial visualization, Repast’s multi-view inspection. But most current tools are good at showing <em>what</em> the simulation produced. Far fewer help you understand <em>why</em>, <em>which mechanisms</em> drove the outcome, or <em>how confident</em> you should be. The most valuable insights come from iteration — a researcher poking at the model mid-run, asking “What if I changed this?” or “Why did that cluster behave that way?”</p>

<p><strong>Figure 5 — From black-box outputs to a live, provenance-aware analysis copilot</strong></p>

<p><img src="/Social-Complexity-Insights/assets/images/blog-social-systems-02-simulating-society-age-of-ai/fig05-traditional-vs-llm-augmented-abm-workflow.png" alt="Split workflow: overwhelmed researcher with static charts versus copilot-assisted exploration of a live simulation with traceable links from natural-language questions to data and mechanisms." /></p>

<p>Generative AI opens a genuine research opportunity here — not prettier dashboards, but what I’d call <strong>mechanism-oriented, provenance-aware interactive analysis</strong>. Imagine a simulation copilot that lets you query a running simulation in natural language: “Show me the moment polarization began to accelerate.” “What factors correlate with agents who defected from the norm?” “Summarize this run and flag the anomalies.” Each answer comes with a provenance trail — where the data came from, what assumptions were made, how sensitive the conclusion is.</p>

<p>For anyone who’s worked on observability in distributed computing — tracing requests through microservices, correlating logs across components — this has a familiar shape. <em>The ABM analysis workbench is, in a sense, an observability platform for simulated societies.</em></p>

<p>And there’s a deeper reason this matters: as we incorporate AI-driven agents into simulations, <em>explainability</em> becomes critical. If an LLM-powered agent makes a surprising decision, can we explain why? The human-in-the-loop isn’t just a usability feature — it’s a safeguard for scientific rigor.</p>

<hr />

<h2 id="force-2-scale-changes-everything--but-not-how-you-think">Force #2: Scale Changes Everything — But Not How You Think</h2>

<p>A provocative claim: most agent-based models today are too small to tell us what we really want to know.</p>

<p>Simulating 1,000 agents can reveal interesting dynamics. But many phenomena — pandemic spread, market crashes, political polarization — are inherently large-scale, emerging from vast numbers of heterogeneous actors, and behaving very differently at population scale than in a small sandbox.</p>

<p>The infrastructure is finally catching up. <strong>FLAME GPU 2</strong> brings GPU-accelerated ABM with flexible agent communication. <strong>AgentTorch</strong> (MIT Media Lab, built on PyTorch) simulates millions of agents on commodity GPUs, is fully differentiable, and has already modeled COVID-19 dynamics across New York City’s 8.4 million residents. <strong>Repast4Py</strong> extends Repast into Python with MPI-based cluster distribution.</p>

<p><strong>Figure 6 — Sandbox versus population scale: where emergent behavior actually shows up</strong></p>

<p><img src="/Social-Complexity-Insights/assets/images/blog-social-systems-02-simulating-society-age-of-ai/fig06-sandbox-to-population-scale-emergence.png" alt="Scale contrast: a small “sandbox” dome of few agents beside a vast population-scale dome with dense interactions and wave-like emergent patterns—fidelity often demands running at real scale." /></p>

<p>AgentTorch deserves special attention from anyone with an optimization background. Differentiable simulation changes the game: gradient-based calibration instead of brute-force sweeps, one-shot sensitivity analysis via automatic differentiation, end-to-end optimization coupling simulation with learned modules. This isn’t a performance trick — it changes the <em>epistemic workflow</em>.</p>

<p>And there’s a beautiful irony: the AI hardware boom has produced an explosion of GPU capacity worldwide. Frameworks like AgentTorch turn tensor-processing units into social simulation engines. The same chips built to power chatbots can also power digital societies.</p>

<p><strong>But scale without validation is just expensive noise.</strong></p>

<p>The bottleneck is no longer “Can we run a million agents?” It’s “Can we calibrate a million-agent model and prove it’s trustworthy — not just for the aggregate, but for specific subgroups?” Calibrating a large-scale stochastic ABM against heterogeneous data is structurally similar to hard systems-optimization problems: high-dimensional parameter spaces, non-convex landscapes, identifiability issues. There’s significant room for improvement here.</p>

<h3 id="where-llms-help-and-dont-in-data-preparation">Where LLMs Help (and Don’t) in Data Preparation</h3>

<p>Building realistic large-scale simulations also requires rich input: demographic distributions, network structures, behavioral patterns. Traditionally a massive bottleneck.</p>

<p>LLMs provide genuine value in the “glue work”: extracting constraints from messy documents, mapping schemas across data sources, generating documentation, auditing synthetic population pipelines. What they should <em>not</em> yet be trusted to do is generate population characteristics directly — the risk of importing training-data stereotypes into a simulation’s foundation is too high. Census-derived synthetic populations via statistical methods remain the defensible core. <strong>LLMs are best positioned as pipeline assistants, not replacements.</strong></p>

<p><strong>Figure 7 — Data to simulation: LLMs as pipeline glue, statistics as the defensible core</strong></p>

<p><img src="/Social-Complexity-Insights/assets/images/blog-social-systems-02-simulating-society-age-of-ai/fig07-data-pipeline-llm-assisted-synthesis.png" alt="Horizontal pipeline from messy sources through LLM-assisted extraction and statistical synthesis, past a validation gate, into GPU-backed simulation—LLM role bounded, not a substitute for census-grade inputs." /></p>

<hr />

<h2 id="force-3-smarter-agents--scaffolded-not-autonomous">Force #3: Smarter Agents — Scaffolded, Not Autonomous</h2>

<p>The first two forces improve ABM’s <em>infrastructure</em>. This one changes the <em>nature</em> of the agents themselves — and generates the most excitement and the most risk.</p>

<p>Traditional ABM agents follow simple rules: if-then logic, probability distributions, utility functions. Useful, but brittle. Real humans are contextual, adaptive, and maddeningly inconsistent.</p>

<p>Enter generative agents. In 2023, Joon Sung Park and colleagues created a town of 25 LLM-powered agents that planned their days, formed relationships, organized a Valentine’s Day party, and spread information through social networks — exhibiting emergent behaviors never explicitly programmed. Since then, Project Sid scaled to 1,000+ agents developing professions and democratic laws in Minecraft; AgentSociety simulated 10,000+ agents reproducing polarization and policy-response dynamics.</p>

<p>Impressive engineering. But the central challenge isn’t making agents more eloquent — it’s making the <em>system</em> trustworthy.</p>

<p><strong>Figure 8 — Three generations of agents—and the validation wall before “eloquent” counts as evidence</strong></p>

<p><img src="/Social-Complexity-Insights/assets/images/blog-social-systems-02-simulating-society-age-of-ai/fig08-three-generations-abm-validation-wall.png" alt="Evolution from rule-based to statistical agents to LLM-powered agents, with a explicit validation wall between classical stochastic agents and generative ones." /></p>

<h3 id="the-integration-spectrum">The Integration Spectrum</h3>

<p>Integrating LLMs into ABM is a spectrum of architectural patterns with different cost-fidelity trade-offs:</p>

<p><strong>LLM as policy generator:</strong> the simulation core stays fast; the LLM periodically produces goals or decision templates. Minimizes API calls, preserves reproducibility.</p>

<p><strong>Archetype-based querying:</strong> query representative types and apply responses to clusters of similar agents. AgentTorch’s “LLM archetypes” formalizes this — but how much diversity do you sacrifice for feasibility?</p>

<p><strong>Differentiable hybrid architectures:</strong> tensorized backbone with LLM modules for decision logic and communication, optimizable end-to-end.</p>

<p>This framing — agency as a resource to allocate and optimize — resonates strongly with my background in heterogeneous computing resource management. The parallels are structural: managing computational resources with different cost-quality trade-offs, under constraints linking local decisions to global behavior.</p>

<h3 id="the-validation-wall">The Validation Wall</h3>

<p><strong>The uncomfortable truth:</strong> LLM-driven agents can produce behavior that <em>looks</em> realistic without being <em>scientifically valid</em>.</p>

<p>A simulation might generate fluent dialogue, plausible demographic variation, and convincing narratives — and still fail because its causal mechanisms are wrong, subgroup behavior is distorted by training-data bias, or apparent emergence is actually memorized pre-training patterns. <strong>This is the deepest reason validation has become the field’s central problem.</strong></p>

<p><strong>Hallucination:</strong> a fabricated agent memory can propagate through the network and distort emergent outcomes. <strong>Grounding strategies become methodological necessities.</strong></p>

<p><strong>Representation gap:</strong> LLMs capture majority viewpoints; computational social science needs specific subpopulations. An LLM might generate a convincing response for a “65-year-old farmer in rural Indonesia,” but how faithful is it? Domain-specific fine-tuning or specialized foundation models may be needed.</p>

<p><strong>Black box:</strong> when an LLM agent acts, the reasoning is locked inside billions of parameters. Could we bridge this by connecting internal model states to social science theories — mapping activation patterns to bounded rationality or conformity pressure? It’s ambitious and carries epistemic risk, but even a more grounded step — behavioral interpretability under controlled conditions — would be valuable.</p>

<p>A long shot. But the kind of cross-disciplinary challenge that keeps me excited.</p>

<hr />

<h2 id="the-wild-card-when-ai-agents-join-human-society">The Wild Card: When AI Agents Join Human Society</h2>

<p>The three forces above describe how we build better <em>simulations</em> of human society. The wild card asks a different question: what happens when agents leave the simulation and operate in the real world alongside us?</p>

<p>This isn’t hypothetical. AI agents already complete purchases on behalf of users, negotiate in constrained economic settings, and manage routine transactions. The infrastructure for agent-to-agent commerce is being actively built. Industry analysts project trillions of dollars in AI-mediated consumer commerce by decade’s end.</p>

<p>Now extrapolate from shopping to everything else.</p>

<p><strong>Figure 9 — Hybrid marketplace: humans, AI delegates, and agent-to-agent flows</strong></p>

<p><img src="/Social-Complexity-Insights/assets/images/blog-social-systems-02-simulating-society-age-of-ai/fig09-hybrid-human-ai-marketplace.png" alt="Isometric market with human-staffed, AI-staffed, and joint stalls; overlay of delegation edges and agent negotiation lines, with open questions over emergent crowd patterns." /></p>

<p>Remember the budget negotiation thought experiment from the opening? That’s one instance of a broader pattern. Corporate coordination, economic transactions — buying a house, bidding in an auction — even routine commerce could increasingly be conducted by AI agents on behalf of human principals. AI agents armed with comprehensive market data could level the playing field, giving every participant expert-level support.</p>

<p>And here’s a question I keep returning to: if your customer’s first point of contact is their AI agent, who does the advertisement need to convince? Does “brand loyalty” mean anything when an algorithm makes the purchasing decisions? The internet and smartphones radically changed commerce because they redirected human attention to digital screens. If attention shifts to AI intermediaries, the entire logic of persuasion and information design may need reinvention.</p>

<p>This isn’t just speculation. Research on reinforcement-learning pricing agents shows they can learn to sustain supra-competitive prices without explicit communication — a phenomenon resembling algorithmic collusion that has already raised regulatory concerns.</p>

<h3 id="a-new-unit-of-analysis">A New Unit of Analysis</h3>

<p>For computational social science, the unit of analysis shifts. We need to model not just humans, but:</p>

<ul>
  <li><strong>Human principals</strong> and their intent</li>
  <li><strong>AI delegates</strong> and their capabilities, biases, and failure modes</li>
  <li><strong>Platforms and institutions</strong> mediating the interactions</li>
  <li><strong>Oversight structures</strong> maintaining human control</li>
</ul>

<p>This is a <em>systems</em> problem at the deepest level — not how smart one agent is, but what emergent institutional behavior arises when entire organizations and markets are AI-mediated.</p>

<blockquote>
  <p>And a civilizational question: <em>if we outsource negotiation, argument, and compromise to machines, what happens to our social skills, our empathy, our ability to navigate conflict?</em></p>
</blockquote>

<p><strong>Figure 10 — New unit of analysis: principals, delegates, platforms, oversight</strong></p>

<p><img src="/Social-Complexity-Insights/assets/images/blog-social-systems-02-simulating-society-age-of-ai/fig10-principals-delegates-platforms-oversight.png" alt="Layered schematic: human intent flows to AI delegates, platform-mediated horizontal interaction, and upward oversight—inside a dome of emergent institutional behavior." /></p>

<hr />

<h2 id="connecting-the-dots-a-layered-research-stack">Connecting the Dots: A Layered Research Stack</h2>

<p>Stepping back through a systems engineering lens, these four themes aren’t independent directions — they’re layers of a single research stack.</p>

<p><strong>Figure 11 — The unified research stack: from scalable simulation backbone to hybrid society frontier</strong></p>

<p><img src="/Social-Complexity-Insights/assets/images/blog-social-systems-02-simulating-society-age-of-ai/fig11-layered-research-stack-trust-pillar.png" alt="Layered architecture from validation-first scalable ABM through LLM-assisted exploration, benchmarks, institutional testbeds, and long-run information design—with trust and accountability as a vertical pillar." /></p>

<p><strong>The foundation: a scalable, validation-first ABM backbone.</strong> This is the technical spine. Build a simulation system that is hardware-accelerated and designed from the ground up with subgroup-sensitive validation as a first-class requirement. This is where systems engineering and optimization experience maps most directly — the problems of calibrating high-dimensional stochastic systems, managing heterogeneous computational resources, and building robust testing infrastructure are deeply familiar.</p>

<p><strong>The interaction layer: provenance-preserving, LLM-assisted exploration.</strong> Use LLMs to reduce friction across the research workflow — extracting rules from literature, querying simulation results in natural language, generating documentation — but with full traceability. Every LLM-generated element should carry a provenance tag. This layer is immediately actionable and provides the foundation for validating everything above it.</p>

<p><strong>The validation layer: formal benchmarks for LLM-enhanced ABM.</strong> Turn vague concerns about “realism” and “bias” into concrete, testable criteria. Can the model reproduce known subgroup differences? Does it remain stable across random seeds, prompt variations, and model versions? Do intervention experiments produce theoretically consistent responses? This is the layer that transforms ABM from a storytelling tool into a scientific instrument.</p>

<p><strong>The application frontier: controlled testbeds for AI-mediated institutional interaction.</strong> Start with well-defined settings — negotiation, budget allocation, auction mechanisms — and study what happens when agents mediate human goals. This is where fundamental research meets practical relevance.</p>

<p><strong>The long-term frontier: understanding the hybrid society.</strong> Once AI agents become routine intermediaries in commerce, governance, and communication, how do we model the co-evolution of human and artificial actors? Who designs the information that AI agents consume? How do persuasion, framing, and manipulation work when the first audience is an algorithm?</p>

<p>These aren’t five separate projects. They’re layers of one stack, and the strength lies in their integration.</p>

<hr />

<h2 id="looking-ahead">Looking Ahead</h2>

<p>I don’t claim to have the answers. I’m a systems engineer with deep curiosity about complex social systems, not a social scientist with decades of domain expertise. But cross-pollination between fields is exactly what this moment requires. The challenges of scaling social simulation, making it interactive, and integrating AI are fundamentally <em>systems problems</em>.</p>

<p>What excites me most is the <em>convergence</em>. For the first time, we have language models that approximate human behavior, hardware for population-scale simulation, frameworks bridging the two, and — if we build it right — validation infrastructure to keep it honest.</p>

<p><strong>Figure 12 — Convergence: LLMs, hardware, and social simulation into a trustworthy stack</strong></p>

<p><img src="/Social-Complexity-Insights/assets/images/blog-social-systems-02-simulating-society-age-of-ai/fig12-convergence-trustworthy-research-stack.png" alt="Three rivers—generative language, compute hardware, and ABM/social science—merge toward a lighthouse-like “trustworthy research stack,” optimistic but grounded." /></p>

<p>If there’s one thesis I’d want readers to take away: <strong>the most impactful contributions won’t come from building the biggest simulation or the smartest agent. They’ll come from building the most trustworthy research stack</strong> — transparent in its assumptions, rigorous in its validation, honest about its limitations, and designed to keep humans meaningfully in the loop.</p>

<p>And if society increasingly involves AI agents as mediators and participants in human institutions, building that stack isn’t just academic. <strong>It’s a prerequisite for understanding the world we’re building.</strong></p>

<p>That’s a question worth spending a career on.</p>

<hr />

<p><em>I’m a systems engineer by training, with a background in modeling, simulation, and optimization for computing architectures. I’m drawn to the intersection of agent-based modeling, computational social science, and AI — not because I have answers, but because I find the questions irresistible. If these threads resonate, or if you think I’m wrong about something, I’d love to hear from you. The best research comes from conversations between people who see the world differently.</em></p>

<hr />]]></content><author><name>Jiyuan Shi</name></author><summary type="html"><![CDATA[Figure 1 — Where two worlds converge: simulation science meets the generative AI era]]></summary></entry><entry><title type="html">Between Convenience and Autonomy: How the Things That Felt “Off” Revealed the System Underneath</title><link href="https://stevenbush.github.io/Social-Complexity-Insights/2026/03/29/convenience-autonomy-and-hidden-architectures/" rel="alternate" type="text/html" title="Between Convenience and Autonomy: How the Things That Felt “Off” Revealed the System Underneath" /><published>2026-03-29T00:00:00+08:00</published><updated>2026-03-29T00:00:00+08:00</updated><id>https://stevenbush.github.io/Social-Complexity-Insights/2026/03/29/convenience-autonomy-and-hidden-architectures</id><content type="html" xml:base="https://stevenbush.github.io/Social-Complexity-Insights/2026/03/29/convenience-autonomy-and-hidden-architectures/"><![CDATA[<p><strong>Figure 1 — Overview: everyday contrasts and the hidden architectures beneath</strong></p>

<p><img src="/Social-Complexity-Insights/assets/images/blog-social-systems-01-convenience-autonomy/fig01-opening-overview-europe-china-systems.png" alt="Opening overview: European and Chinese everyday scenes with systems-thinking overlays—feedback loops, networks, and layered architecture suggesting hidden social mechanisms beneath surface behavior." /></p>

<hr />

<h2 id="a-tale-of-two-supermarkets">A Tale of Two Supermarkets</h2>

<p><strong>Figure 2 — Two supermarket worlds: regulation, density, and delivery as system outcomes</strong></p>

<p><img src="/Social-Complexity-Insights/assets/images/blog-social-systems-01-convenience-autonomy/fig02-tale-of-two-supermarkets-europe-china-retail.png" alt="Europe: Sunday closing and distance versus China: night economy, density, and integrated delivery—everyday retail as emergent property, not random cultural difference." /></p>

<p>A few years into living in Europe, I found myself standing in front of a closed supermarket on a Sunday afternoon, grocery bag in hand, feeling mildly annoyed. Back in China, I could have walked into any convenience store on any street corner at nearly any hour. Here, the nearest shop was a fifteen-minute drive away — and it was closed.</p>

<p>That small inconvenience stuck with me longer than it should have. Not because it was a hardship — it wasn’t — but because it was a thread I kept pulling. The more I pulled, the more I realized it was connected to something much larger: a web of interdependent social mechanisms that shape how entire societies function, how organizations operate, and how individuals experience daily life.</p>

<p>I have spent most of my career working on complex IT systems — optimizing resource allocation in cloud data centers, designing simulation models for heterogeneous processor architectures, and studying cache behavior in CPUs. These are systems where small design choices ripple outward, where trade-offs are everywhere, and where the “best” solution is almost never obvious. As I moved between Asia and Europe, I started noticing that human societies behave in strikingly similar ways. The same architectural tensions I wrestled with in computing — centralization vs. distribution, efficiency vs. resilience, responsiveness vs. autonomy — seemed to play out in the streets, hospitals, offices, and governments around me.</p>

<p>This blog post is an attempt to lay out those observations honestly. I am not here to declare which system is better. I am here to share what I have seen, the questions these observations raise, and why I believe computational modeling — particularly agent-based modeling — might be one of the most powerful lenses through which to study these dynamics.</p>

<hr />

<h2 id="part-i-the-fabric-of-everyday-life">Part I: The Fabric of Everyday Life</h2>

<h3 id="convenience-autonomy-and-the-price-of-a-service">Convenience, Autonomy, and the Price of a Service</h3>

<p><strong>Figure 3 — Household self-reliance versus app-mediated service access</strong></p>

<p><img src="/Social-Complexity-Insights/assets/images/blog-social-systems-01-convenience-autonomy/fig03-diy-home-repair-vs-app-services.png" alt="Split scene: DIY home repair in a European-style setting versus ordering services through a smartphone app in a Chinese-style setting." /></p>

<p>Living in Europe, you learn to be self-reliant fairly quickly. You mow your own lawn. You fix a leaky faucet yourself, or you pay a serious premium for a plumber. You file your own taxes — a process that can consume an entire weekend of gathering documents, navigating government portals, and double-checking figures. You plan your grocery shopping for the week, because the store may not be open when you need it.</p>

<p>In China, the rhythm is different. A quick tap on your phone brings a repairman to your door at a fraction of the European cost. Tax filings and bank procedures, while not paperwork-free, are handled with remarkable speed by dedicated service staff. Food delivery — fast, cheap, and available at almost any hour — is not a luxury but a daily routine for millions of working professionals. Convenience stores dot every neighborhood, open seven days a week, often late into the night.</p>

<p>At first glance, one might simply label one society “inconvenient” and the other “convenient.” But that framing misses the deeper story. <strong>These are not random differences — they are emergent properties of interconnected social mechanisms, each reinforcing the other.</strong></p>

<h3 id="the-feedback-loop-nobody-designed">The Feedback Loop Nobody Designed</h3>

<p>Here is what I keep turning over in my mind.</p>

<p>In Europe, individuals reserve significant personal time for managing their own affairs. This means less of their time is available for providing services to others. Naturally, when someone does offer their time as a service, it commands a higher price. High service costs, in turn, reinforce the habit of self-reliance. And because people need that personal time, working hours and shop opening times are kept within boundaries — further reducing service availability. The cycle continues: lower convenience, higher autonomy, and a social norm that accepts slower timelines.</p>

<p>In China, the dynamic runs in the opposite direction. Affordable third-party services encourage people to outsource daily tasks. But here is the part that is easy to overlook: every service consumed is a service someone else must provide. The delivery rider working through his lunch break is enabling your lunch break. The bank clerk processing your paperwork at 7 PM is freeing your evening. As more people rely on services, demand grows, working hours extend, personal time shrinks — and the need for yet more services increases. The service is cheap, so everyone uses it. Everyone uses it, so everyone is busy providing it.</p>

<p><strong>Which came first — the cheap service or the dependency on it? Is the low price a cause or a consequence? And once this feedback loop is in motion, would raising prices even change anything?</strong></p>

<p><em>I genuinely do not know the answers.</em> But I find the questions fascinating, because they describe a classic complex adaptive system — one where macro-level patterns emerge from micro-level interactions, and where causality is circular rather than linear.</p>

<p><strong>Figure 4 — Reinforcing loops behind autonomy and convenience</strong></p>

<p><img src="/Social-Complexity-Insights/assets/images/blog-social-systems-01-convenience-autonomy/fig04-feedback-loops-autonomy-convenience.png" alt="Two feedback loops: the European autonomy cycle and the Chinese convenience cycle, with arrows linking key factors in each." /></p>

<h3 id="tolerance-for-delay-a-hidden-variable">Tolerance for Delay: A Hidden Variable</h3>

<p>There is another dimension to this: the collective expectation around how fast things should happen.</p>

<p>In Europe, people seem to carry an implicit assumption that things take time. A government permit might take weeks. A medical appointment might be months away. An online order might arrive in three to five business days. And that is fine — because the social contract is built around this pace. You plan ahead. You wait. Life adjusts.</p>

<p>In China, the baseline expectation is speed. Same-day delivery. Government approvals processed in hours. Instant responses on messaging apps. When something takes longer than expected, the friction is real — not just logistically, but emotionally. The tolerance for delay is lower because the system has trained everyone to expect immediacy.</p>

<p><strong>This is not a matter of patience or impatience as personal traits. It is about what the system conditions its participants to expect.</strong> And that conditioned expectation, in turn, shapes the system itself.</p>

<h3 id="so-what-does-each-pattern-produce">So What Does Each Pattern Produce?</h3>

<p><strong>Neither pattern is inherently superior.</strong> Each generates distinct outcomes that may be advantageous in different contexts.</p>

<p>The European pattern, with its emphasis on individual autonomy and slower rhythms, seems to create conditions where people have more cognitive and temporal space. Less time pressure, more room for reflection. One might speculate — and this is only speculation — that this could partially explain why certain forms of artistic creativity and fundamental scientific inquiry have historically flourished in Western contexts. These are activities that often require unstructured time and a tolerance for slow, uncertain progress.</p>

<p>The Chinese pattern, with its emphasis on collective efficiency and rapid service delivery, generates extraordinary throughput. This is a system optimized for speed — for scaling up production, for industrializing new technologies, for executing massive infrastructure projects in compressed timeframes. When the goal is rapid development and large-scale deployment, this system excels.</p>

<p><strong>But these are hypotheses, not conclusions.</strong> The actual mechanisms are far more complex, shaped by history, culture, policy, demographics, and countless other variables. Understanding them properly requires more than anecdotes — it requires rigorous, systematic investigation.</p>

<hr />

<h2 id="part-ii-the-organization-as-a-microcosm">Part II: The Organization as a Microcosm</h2>

<p><strong>Figure 5 — Trust-based coordination versus process-heavy hierarchy</strong></p>

<p><img src="/Social-Complexity-Insights/assets/images/blog-social-systems-01-convenience-autonomy/fig05-organization-flat-network-vs-hierarchy.png" alt="Contrasting organizations: a flat distributed network versus a hierarchical centralized tree." /></p>

<p>The patterns I observed at the societal level also showed up at a smaller scale — inside the teams and organizations I worked in.</p>

<h3 id="trust-based-vs-process-based-management">Trust-Based vs. Process-Based Management</h3>

<p>In European teams I have been part of, the management style leaned toward what I would call <em>distributed and trust-based</em>. Goals and milestones were set collaboratively, and once agreed upon, people were largely left to execute independently. Check-ins happened at defined intervals, not constantly. Reporting was minimal — a brief weekly sync, perhaps a monthly review. Decisions that did not require strategic alignment were made by the individual closest to the problem. Even attendance tracking was relaxed: as long as you delivered quality work on time, nobody questioned whether you were at your desk at 9 AM.</p>

<p>In Chinese teams I have worked with, the style was noticeably different — more <em>centralized and process-driven</em>. Daily reports, weekly reports, sometimes even ad-hoc status updates requested at short notice. Decisions, even relatively minor ones, often escalated to higher management layers. Objectives shifted more frequently, which in turn necessitated frequent realignment meetings. Attendance was tracked carefully. The overall feel was one of tighter control — management wanting visibility into the process, not just the outcome.</p>

<h3 id="why-the-difference--and-does-it-matter">Why the Difference — and Does It Matter?</h3>

<p>Again, I resist the urge to judge. Instead, I find myself asking: what produces these different patterns, and what does each pattern produce in return?</p>

<p>The trust-based model works well when requirements are stable and individuals are empowered to make local decisions. <strong>It minimizes communication overhead — something any distributed systems engineer knows is critical.</strong> Each person can enter a state of deep focus, iterate on their work without frequent interruption, and produce outputs that benefit from sustained attention. For tasks requiring creativity, innovation, or meticulous craftsmanship, this model seems well-suited.</p>

<p>But when requirements change rapidly, this model can be slow to respond. A distributed system with infrequent synchronization may drift out of alignment. Adaptation requires propagating new information to all nodes, and that takes time.</p>

<p>The process-driven model, by contrast, is highly responsive to change. Frequent reporting means management has near-real-time visibility. Centralized decision-making means pivots can happen quickly. This is valuable in fast-moving markets, in large-scale operations where coordination is paramount, and in environments where the cost of misalignment is high.</p>

<p><strong>The trade-off? The communication overhead itself becomes a significant load.</strong> When a substantial portion of everyone’s workday is consumed by status updates, alignment meetings, and report preparation, less time remains for the actual work. Individual focus is fragmented. And paradoxically, the heavier the process burden, the more management may feel the need to monitor closely — because they sense that productivity is not where it should be. <strong>This can create its own feedback loop: more monitoring leads to more overhead, which leads to lower individual output, which leads to more monitoring.</strong></p>

<p>There is a concept in distributed computing called <strong>control plane overhead</strong> — the cost of managing the system as opposed to doing useful work. Every management layer, every status report, every alignment meeting is part of the control plane. <strong>The question is always: at what point does the control plane start consuming more resources than it saves?</strong></p>

<p><strong>Figure 6 — Useful work lost to coordination overhead</strong></p>

<p><img src="/Social-Complexity-Insights/assets/images/blog-social-systems-01-convenience-autonomy/fig06-useful-work-vs-coordination-overhead.png" alt="Fixed capacity bar comparing trust-based and process-driven models: useful work versus coordination overhead." /></p>

<hr />

<h2 id="part-iii-healthcare--a-microcosm-of-system-design">Part III: Healthcare — A Microcosm of System Design</h2>

<p>Perhaps the most vivid illustration of these dynamics appears in healthcare — a domain where system architecture directly shapes the experience of something deeply personal: being sick and seeking help.</p>

<h3 id="the-distributed-model">The Distributed Model</h3>

<p>In many European countries, healthcare is structured around a distributed model. Your first point of contact is a family doctor or community clinic. For common ailments — a cold, a minor injury, a skin rash — you are typically advised to rest, take over-the-counter medication, and wait it out. Prescriptions for everyday conditions tend to carry higher dosages than their Chinese equivalents, perhaps because the system implicitly expects patients to manage more on their own between appointments.</p>

<p>This distributed architecture has clear advantages. <strong>Medical resources are spread across many nodes, preventing any single point from being overwhelmed.</strong> When you do get an appointment, the experience is typically unhurried — the doctor has time for you.</p>

<p>The disadvantage is latency. Getting an appointment can take days or weeks. For non-urgent conditions, you wait. For urgent ones, the system has emergency pathways, but the general experience is one of planned, scheduled access rather than on-demand availability.</p>

<h3 id="the-centralized-model">The Centralized Model</h3>

<p>In China, the gravitational pull is toward large urban hospitals. These institutions offer comprehensive outpatient departments covering virtually every specialty. They are efficient, high-throughput operations — and patients use them for everything from serious diagnoses to minor colds. The reasoning is understandable: why wait for a community clinic appointment when the big hospital can see you today?</p>

<p><strong>The result is a system with impressive responsiveness for individual patients but enormous aggregate pressure on medical staff.</strong> Doctors see patient after patient in rapid succession. The per-patient interaction time is compressed. Quality of the individual experience suffers even as the quantity of services delivered remains high. In extreme cases, this pressure has contributed to tensions between patients and medical professionals — a systemic problem that has received significant public attention in recent years.</p>

<h3 id="the-architectural-parallel">The Architectural Parallel</h3>

<p>To a systems engineer, the parallel is hard to miss. This is another instance of the recurring theme: <strong>distributed load-balancing versus centralized high-throughput provision</strong>. If we think of a healthcare system as a queueing network, one model resembles a distributed multi-server queue — low utilization per server, longer routing delays, but sustainable per-node quality. The other resembles a high-throughput centralized queue — fast access, high server utilization, but risk of overload and degraded service quality under peak demand. Each optimizes for a different objective function. Could we model the transition dynamics — what happens as patient behavior shifts gradually from one architecture to the other? Where are the tipping points?</p>

<p><strong>Figure 7 — Patient routing: distributed care versus hospital concentration</strong></p>

<p><img src="/Social-Complexity-Insights/assets/images/blog-social-systems-01-convenience-autonomy/fig07-healthcare-distributed-vs-centralized-hub.png" alt="Healthcare architectures: distributed nodes versus a centralized hub, with arrows indicating patient flow patterns." /></p>

<hr />

<h2 id="part-iv-what-complex-computing-system-taught-me-about-societies">Part IV: What Complex Computing System Taught Me About Societies</h2>

<p>Here is where my two worlds converge.</p>

<h3 id="lesson-1-separate-the-stable-from-the-volatile">Lesson 1: Separate the Stable from the Volatile</h3>

<p>In my doctoral research on virtual resource management in cloud data centers, I confronted a problem that is provably hard: optimally allocating dynamic workloads across a shifting pool of resources. <strong>No single algorithm can handle all cases optimally.</strong></p>

<p>The breakthrough — modest as it was — came from separating the problem. I identified the stable components of the workload and applied mathematical optimization to those. For the volatile, unpredictable components, I used heuristic methods that did not guarantee optimality but performed well in practice. The combination outperformed either approach used alone.</p>

<p>This principle resonates far beyond data centers. In policy design, in organizational management, in social systems — trying to optimize everything with a single mechanism often fails. <strong>Sometimes the wisest approach is to identify what is stable and what is volatile, and apply different strategies to each.</strong></p>

<h3 id="lesson-2-simple-rules-often-beat-complex-plans">Lesson 2: Simple Rules Often Beat Complex Plans</h3>

<p>During my work on CPU cache replacement strategies, I observed something counterintuitive. Sophisticated, workload-aware replacement policies — designed with great care to predict access patterns — often underperformed in real-world conditions where workloads were mixed and unpredictable. Meanwhile, simple heuristics like LRU (Least Recently Used) or FIFO (First In, First Out) delivered consistently decent results across a wide range of scenarios.</p>

<p><strong>The lesson was humbling: in complex systems with high uncertainty, elegantly simple rules often outperform elaborately optimized ones.</strong> The overhead of complexity — the cost of sensing, deciding, and adapting — can exceed the benefit of the optimizations it enables.</p>

<p>I cannot help but see echoes of this in economic and social policy. Sometimes the most effective interventions are not intricate regulatory frameworks but simple, clear rules that allow the system’s own adaptive mechanisms to operate. This is not an argument against all regulation — it is an observation that in complex adaptive systems, the relationship between mechanism complexity and outcome quality is not always linear.</p>

<h3 id="lesson-3-the-eternal-tension-between-central-and-distributed">Lesson 3: The Eternal Tension Between Central and Distributed</h3>

<p>This is perhaps the most universal pattern I have encountered.</p>

<p>In data center architecture, centralized management gives you global visibility and the ability to compute optimal decisions — but at the cost of scalability, robustness, and communication overhead. Distributed management gives you resilience, scalability, and local responsiveness — but makes global optimization difficult and slow.</p>

<p>In network protocol design, the same tension appears. Should intelligence reside in the network core (where intermediate nodes have broad visibility) or at the edges (where end devices make autonomous decisions based on local conditions)? The internet’s own history has been shaped by this debate, with the end-to-end principle arguing for keeping the network core simple and pushing intelligence to the periphery.</p>

<p>The parallels to economic and social systems are almost too neat. Centrally planned economies offer coordinated resource allocation but struggle with information bottlenecks and adaptability. Market economies distribute decision-making to individual actors, achieving remarkable adaptability but sometimes failing at coordination for collective goals.</p>

<p>But real-world systems — whether computational or social — are rarely purely one or the other. <strong>The most effective architectures tend to be hybrids, with different layers of centralization and distribution applied to different aspects of the system.</strong> Understanding where to centralize and where to distribute is one of the most important design questions in any complex system.</p>

<p><strong>Figure 8 — One spectrum, two domains: centralization and distribution</strong></p>

<p><img src="/Social-Complexity-Insights/assets/images/blog-social-systems-01-convenience-autonomy/fig08-centralized-distributed-spectrum.png" alt="Spectrum from fully centralized to fully distributed, with IT examples mapped to social-system equivalents." /></p>

<hr />

<h2 id="where-this-leads-questions-worth-pursuing">Where This Leads: Questions Worth Pursuing</h2>

<p><strong>I have deliberately left many questions open in this post, because I believe the questions are more valuable than premature answers.</strong> Here are a few that I find particularly compelling:</p>

<p><strong>On social feedback loops:</strong> Can the convenience-autonomy dynamics I described be formally modeled? If we build agent-based models where individuals make local decisions about whether to provide or consume services — with service price, personal time, and social norms as variables — what macro-level patterns emerge? Are there tipping points? Equilibria? Path dependencies that explain why different societies converge on different configurations?</p>

<p><strong>On organizational architecture:</strong> Is there an optimal balance between centralized control and distributed autonomy for a given type of work? How does the nature of the task (creative vs. routine, stable vs. volatile) interact with the management structure to determine outcomes? Can we simulate organizational designs and predict where the “control plane overhead” begins to outweigh its benefits?</p>

<p><strong>On system design and policy:</strong> If simple rules often outperform complex ones in computational systems, does this principle transfer to social policy? Under what conditions? And how do we identify the boundary between the stable and the volatile in social systems, so we can apply the right tools to each?</p>

<p><strong>On healthcare architecture:</strong> Can we model patient flow, resource utilization, and service quality under different healthcare architectures — and identify configurations that achieve both responsiveness and sustainability?</p>

<p>These are not idle questions. They sit at the intersection of computational science, social science, and systems engineering — a space where agent-based modeling, microsimulation, and other computational social science methods can make genuine contributions.</p>

<hr />

<h2 id="a-bridge-between-worlds">A Bridge Between Worlds</h2>

<p>I started this post standing in front of a closed supermarket. I will end it by stating plainly what that moment crystallized for me.</p>

<p>The complex systems I have spent my career studying — data centers, processor architectures, network protocols — are human-made artifacts. They are designed, tuned, and optimized by people who understand that every architectural choice involves trade-offs, that feedback loops can amplify small differences into large divergences, and that the interaction between components matters as much as the components themselves.</p>

<p><strong>Human societies are complex systems too — arguably the most complex systems there are.</strong> They are not designed from a blueprint, but they are shaped by policies, norms, institutions, and the accumulated micro-decisions of millions of individuals. The same principles that govern the behavior of distributed computing systems — feedback, emergence, trade-offs between local and global optimization, the cost of coordination — also govern the behavior of communities, organizations, and nations.</p>

<p>I do not pretend to have answers. <strong>But I believe that bridging the worlds of computational modeling and social science — using tools like agent-based modeling to build “artificial societies” where hypotheses can be tested, parameters can be varied, and emergent behaviors can be observed — is one of the most exciting and important research frontiers of our time.</strong></p>

<p>Different social mechanisms exist for reasons. They produce different outcomes, carry different trade-offs, and serve different needs. Understanding them deeply — not to judge, but to learn — is a pursuit I find endlessly compelling. And if that understanding can eventually inform better policies, better organizations, and better lives, then it is a pursuit worth dedicating a career to.</p>

<p><strong><em>Society, after all, is the most complex system of them all.</em></strong></p>

<hr />

<p><em>About the author: I hold a PhD in Computer Applied Technology, with research experience in data center resource management, embedded AI systems, and heterogeneous processor architecture simulation. My growing interest in computational social science — particularly agent-based modeling of social and collective behavior — drives me to explore how the principles of complex system design can illuminate the dynamics of human societies.</em></p>]]></content><author><name>Jiyuan Shi</name></author><summary type="html"><![CDATA[Figure 1 — Overview: everyday contrasts and the hidden architectures beneath]]></summary></entry></feed>